1
2
3
4
5
6
7
8
9
10
11
12
13
14
15
16
17
18
19
20
21
22
23
24
25
26
27
28
29
30
31
32
33
34
35
36
37
38
39
40
41
42
43
44
45
46
47
48
49
50
51
52
53
54
55
56
57
58
59
60
61
62
63
64
65
66
67
68
69
70
71
72
73
74
75
76
77
78
79
80
81
82
83
84
85
| import pandas as pd
import numpy as np
import matplotlib.pyplot as plt
import matplotlib.dates as mdates
#指定图像样式
plt.style.use('seaborn-v0_8')
#指定字体,防止中文出现乱码,windows系统指定为‘SimHei’
plt.rcParams['font.sans-serif'] = ['SimHei']
#这行代码让中文的负号“-”可以正常显示
plt.rcParams["axes.unicode_minus"]=False
# 1. 创建示例数据(替换为你的实际数据)
df = pd.read_excel('../数据/2-1.xlsx')
df = df[['日期', '收盘']]
df.columns = ['dates','Close']
df['dates'] = pd.to_datetime(df['dates'])
df.set_index('dates', inplace = True)
# 2. 计算简单收益率(日收益率)
df['Simple_Return'] = df['Close'].pct_change() * 100 # 转换为百分比形式[8](@ref)
# 3. 计算20日滚动统计量
window_size = 20
df['Rolling_Mean_Return'] = df['Simple_Return'].rolling(window=window_size).mean()
df['Rolling_Std_Return'] = df['Simple_Return'].rolling(window=window_size).std()
# 4. 计算上下边界和异常值
df['Upper_Bound'] = df['Rolling_Mean_Return'] + 2 * df['Rolling_Std_Return']
df['Lower_Bound'] = df['Rolling_Mean_Return'] - 2 * df['Rolling_Std_Return']
df['Is_Outlier'] = (df['Simple_Return'] > df['Upper_Bound']) | (df['Simple_Return'] < df['Lower_Bound'])
# 5. 可视化
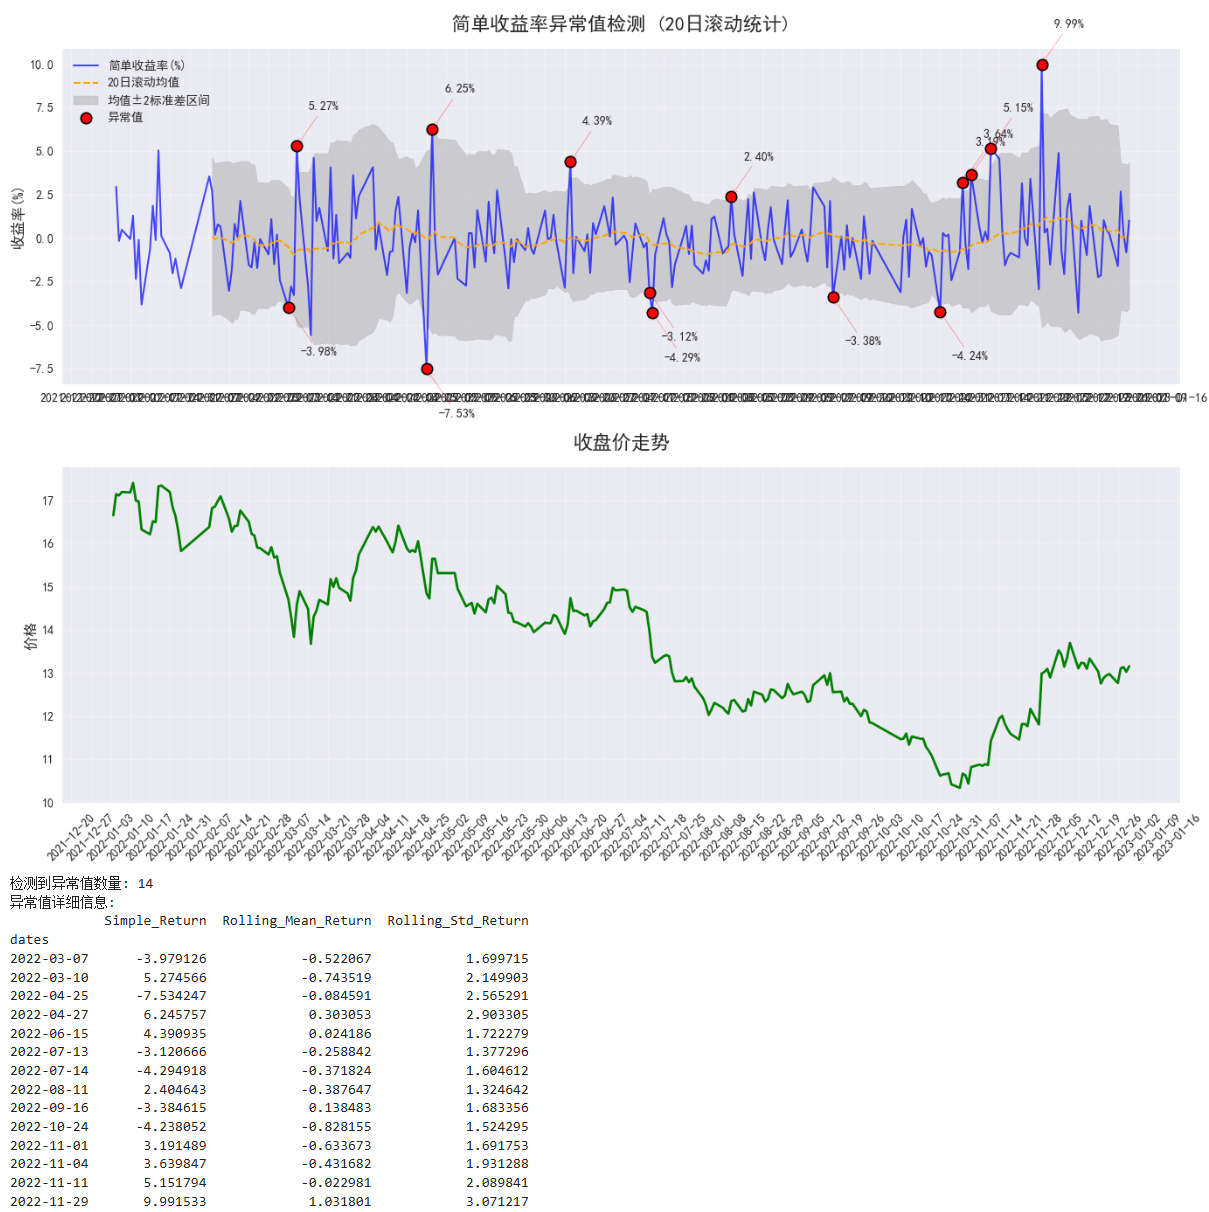
plt.figure(figsize=(14, 10), dpi=100)
# 创建子图布局
ax1 = plt.subplot(2, 1, 1) # 收益率和异常值
ax2 = plt.subplot(2, 1, 2, sharex=ax1) # 收盘价
# 绘制简单收益率和滚动统计
ax1.plot(df.index, df['Simple_Return'], label='简单收益率(%)', color='blue', alpha=0.7, linewidth=1.5)
ax1.plot(df.index, df['Rolling_Mean_Return'], label='20日滚动均值', color='orange', linestyle='--', linewidth=1.5)
ax1.fill_between(df.index, df['Upper_Bound'], df['Lower_Bound'],
color='gray', alpha=0.3, label='均值±2标准差区间')
# 标记异常值
outliers = df[df['Is_Outlier']]
ax1.scatter(outliers.index, outliers['Simple_Return'],
color='red', s=80, zorder=5,
label='异常值', edgecolors='black', linewidth=1.2)
# 添加标注文本
for date, return_val in zip(outliers.index, outliers['Simple_Return']):
ax1.annotate(f'{return_val:.2f}%',
xy=(date, return_val),
xytext=(10, 30 if return_val > 0 else -40),
textcoords='offset points',
arrowprops=dict(arrowstyle="->", color='red', alpha=0.7))
# 绘制收盘价
ax2.plot(df.index, df['Close'], label='收盘价', color='green', linewidth=2)
# 设置图表格式
ax1.set_title('简单收益率异常值检测 (20日滚动统计)', fontsize=16, pad=15)
ax1.set_ylabel('收益率(%)', fontsize=12)
ax1.legend(loc='upper left', framealpha=0.9)
ax1.grid(alpha=0.3)
ax2.set_title('收盘价走势', fontsize=16, pad=15)
ax2.set_ylabel('价格', fontsize=12)
ax2.grid(alpha=0.3)
# 设置日期格式
ax1.xaxis.set_major_formatter(mdates.DateFormatter('%Y-%m-%d'))
ax1.xaxis.set_major_locator(mdates.WeekdayLocator(byweekday=mdates.MO))
plt.xticks(rotation=45)
plt.tight_layout()
# 显示图表
plt.show()
# 6. 输出异常值统计信息
print(f"检测到异常值数量: {len(outliers)}")
print("异常值详细信息:")
print(outliers[['Simple_Return', 'Rolling_Mean_Return', 'Rolling_Std_Return']])
|

