1
2
3
4
5
6
7
8
9
10
11
12
13
14
15
16
17
18
19
20
21
22
23
24
25
26
27
28
29
30
31
32
33
34
35
36
37
38
39
40
41
42
43
44
45
46
47
| # 安装必要库(如未安装)
# pip install cufflinks plotly pandas
import pandas as pd
import cufflinks as cf
from plotly.offline import iplot
# 初始化Cufflinks
cf.go_offline() # 设置离线模式[5,6](@ref)
cf.set_config_file(theme='pearl') # 设置主题样式
# 示例数据(替换为您的DataFrame)
data = {
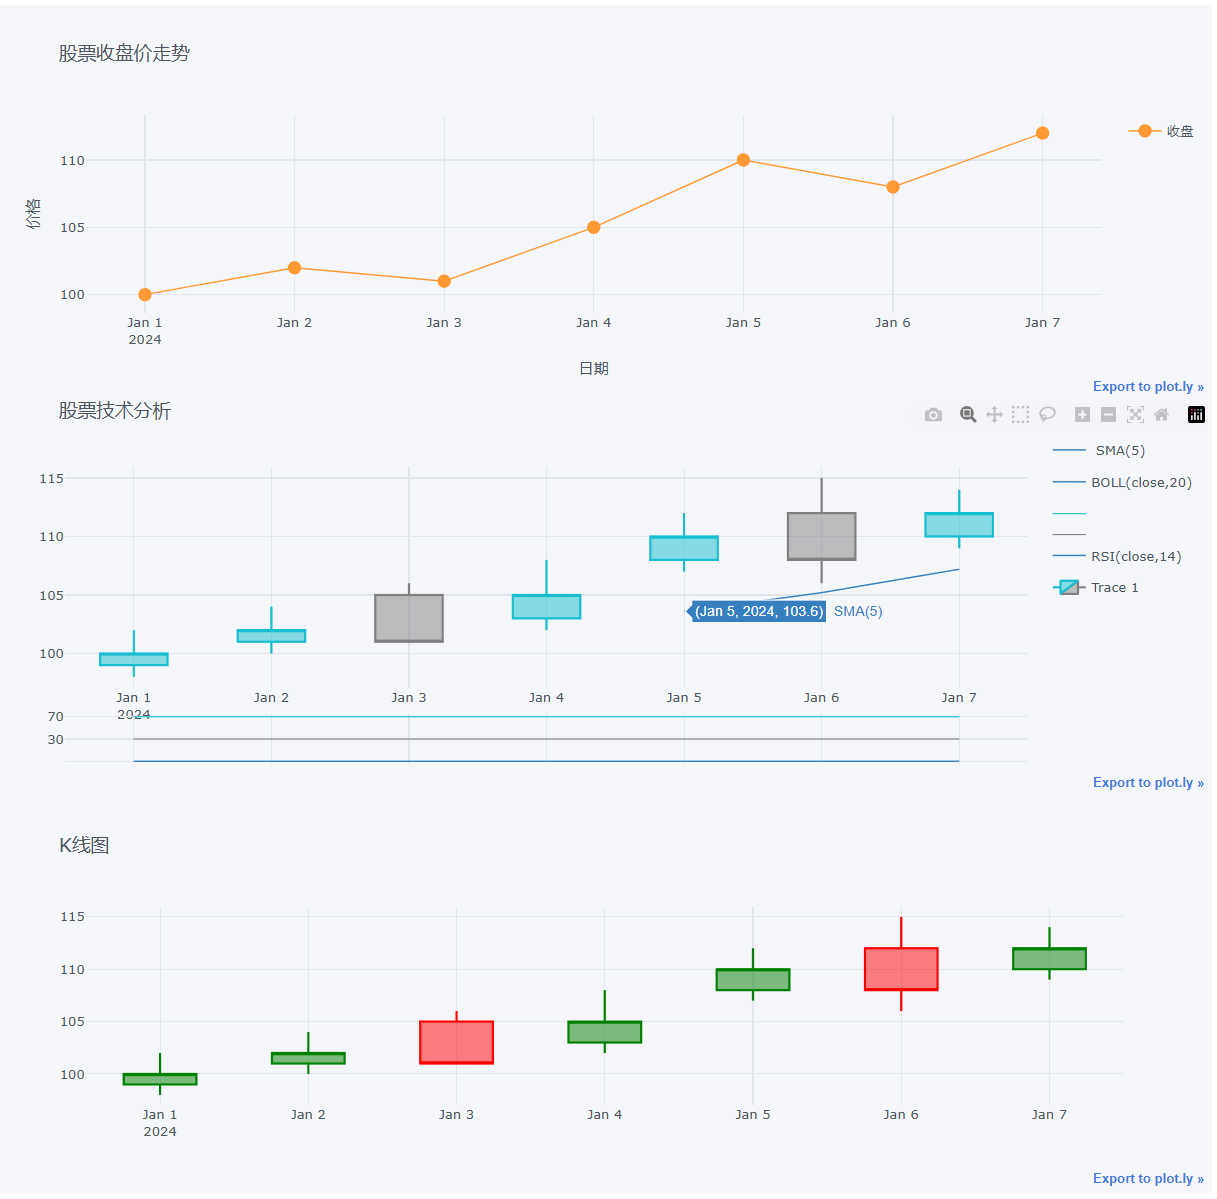
'收盘': [100, 102, 101, 105, 110, 108, 112],
'开盘': [99, 101, 105, 103, 108, 112, 110],
'最高': [102, 104, 106, 108, 112, 115, 114],
'最低': [98, 100, 101, 102, 107, 106, 109]
}
df = pd.DataFrame(data, index=pd.date_range('2024-01-01', periods=7))
# 1. 基础折线图(收盘价)
df[['收盘']].iplot(
kind='line',
title='股票收盘价走势',
xTitle='日期',
yTitle='价格',
legend=True,
mode='lines+markers' # 同时显示线条和标记点[1,6](@ref)
)
# 2. 带技术指标的综合图表
# 确保列名正确
df = df.rename(columns={'收盘': 'close', '开盘': 'open', '最高': 'high', '最低': 'low'})
qf = cf.QuantFig(df, title='股票技术分析', legend=True)
qf.add_sma(periods=5, color='blue') # 添加5日均线[1](@ref)
qf.add_bollinger_bands(periods=20) # 添加布林带[6](@ref)
qf.add_rsi(periods=14, showbands=True) # 添加RSI指标
qf.iplot()
# 3. K线图(需包含OHLC数据)
df[['open','high','low','close']].iplot(
kind='candle',
title='K线图',
up_color='green', # 上涨颜色
down_color='red' # 下跌颜色[4,6](@ref)
)
|


