1
2
3
4
5
6
7
8
9
10
11
12
13
14
15
16
17
18
19
20
21
22
23
24
25
26
27
28
29
30
31
32
| import pandas as pd
import numpy as np
import matplotlib.pyplot as plt
# 生成示例数据(假设日期索引为每月最后一天)
dates = pd.date_range(start='2022-01-31', end='2022-12-31', freq='M')
cpi_data = [280.5, 283.2, 285.1, np.nan, 288.3, 290.0, 292.8, 295.5, 298.2, 302.0, 305.5, 308.0]
df = pd.DataFrame({'CPI': cpi_data}, index=dates)
df.index.name = '日期'
# ==== 数据预处理 ====
# 确保时间序列按日期升序排列(关键步骤)[6](@ref)
df.sort_index(inplace=True)
# ==== 插值填充 ====
# 使用线性插值法填充缺失值(默认沿时间轴插值)[3,7](@ref)
df['CPI_插值'] = df['CPI'].interpolate(method='linear') # 指定插值方法
# ==== 数据验证 ====
print("填充前缺失值数量:", df['CPI'].isnull().sum()) # 预期输出1(4月份缺失)
print("填充后缺失值数量:", df['CPI_插值'].isnull().sum()) # 预期输出0
# ==== 结果可视化 ====
plt.figure(figsize=(12,6))
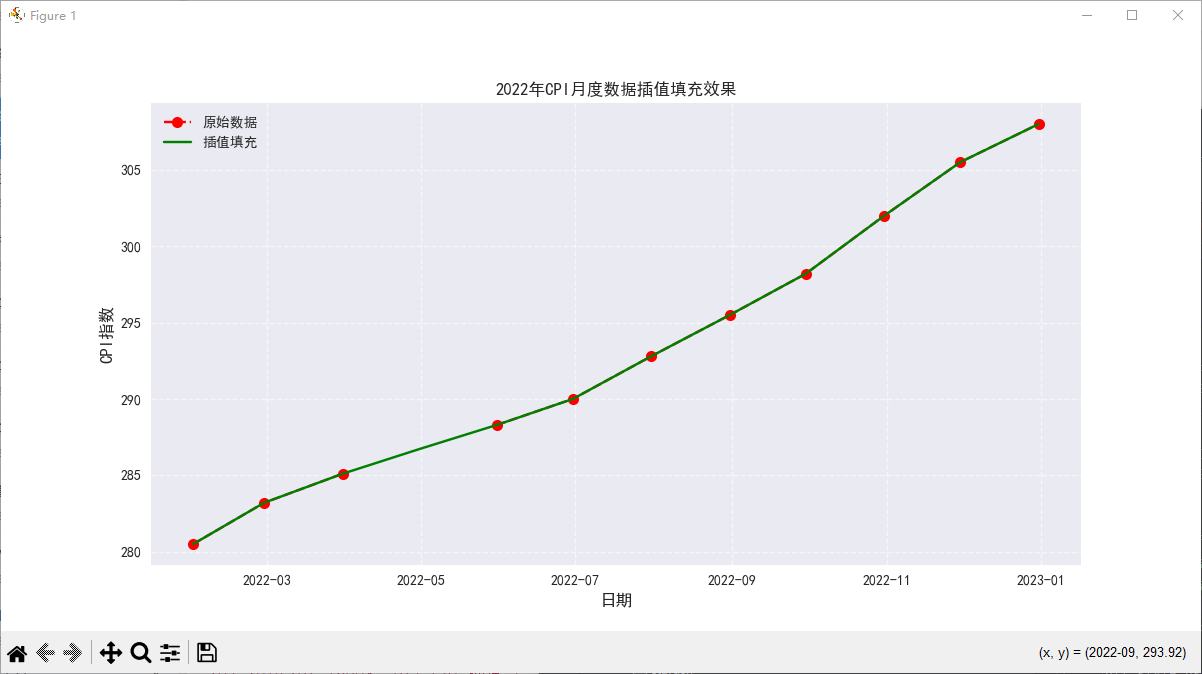
plt.plot(df.index, df['CPI'], 'ro--', label='原始数据', markersize=8)
plt.plot(df.index, df['CPI_插值'], 'gx-', label='插值填充', markersize=10)
plt.title('2022年CPI月度数据插值填充效果')
plt.xlabel('日期', fontsize=12)
plt.ylabel('CPI指数', fontsize=12)
plt.legend()
plt.grid(True, linestyle='--', alpha=0.6)
plt.show()
|

