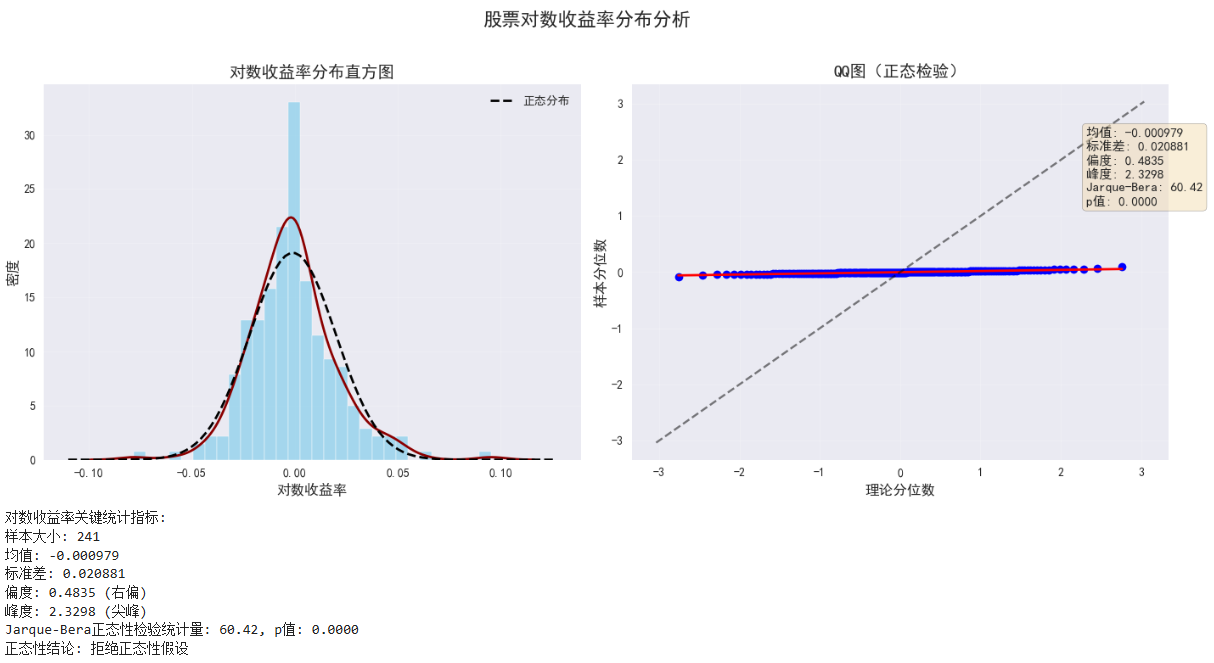
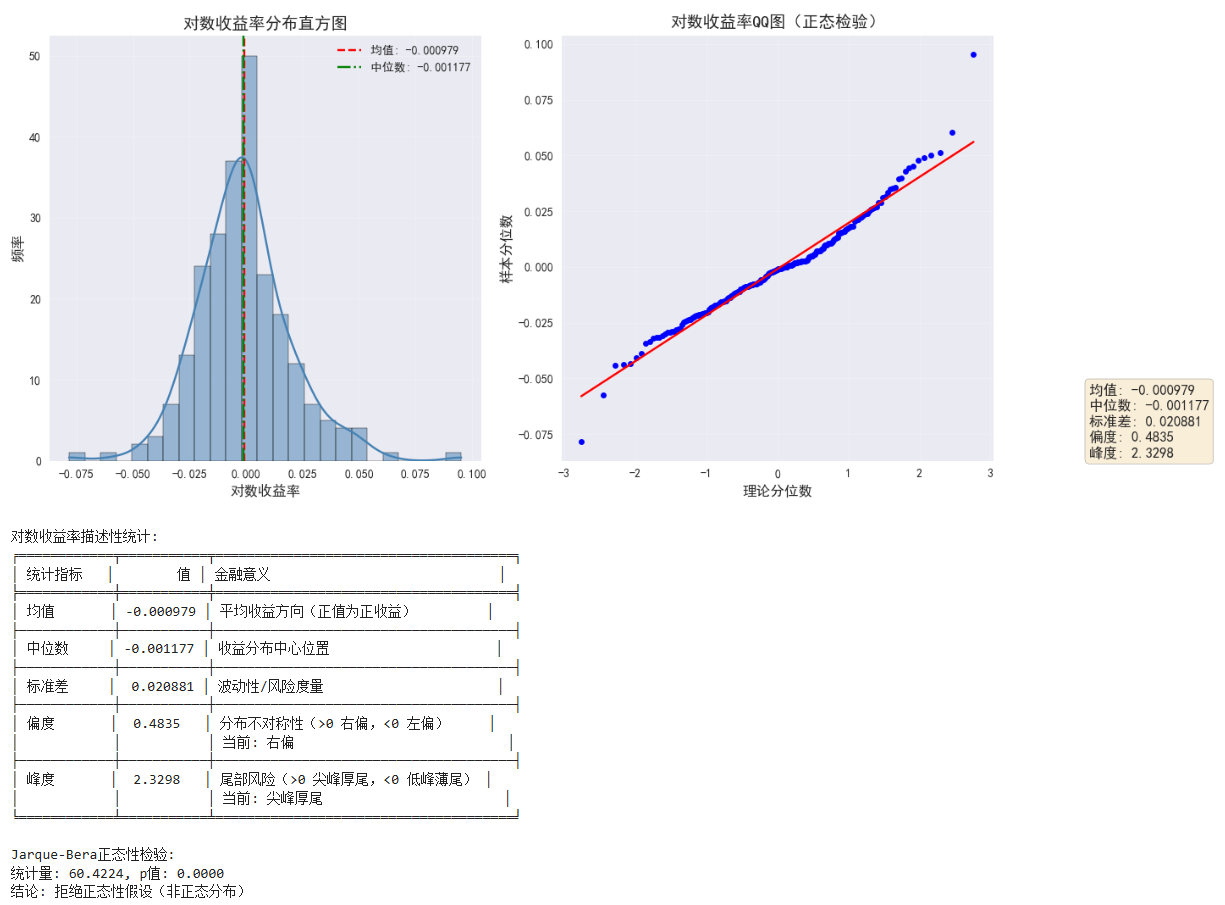
1
2
3
4
5
6
7
8
9
10
11
12
13
14
15
16
17
18
19
20
21
22
23
24
25
26
27
28
29
30
31
32
33
34
35
36
37
38
39
40
41
42
43
44
45
46
47
48
49
50
51
52
53
54
55
56
57
58
59
60
61
62
63
64
65
66
67
68
69
70
71
72
73
74
75
76
77
78
79
80
81
82
83
84
85
86
87
88
89
90
91
92
| import pandas as pd
import numpy as np
import scipy.stats as stats
import matplotlib.pyplot as plt
from tabulate import tabulate # 用于美化表格输出
# 1. 创建示例数据(日期索引,收盘价和对数收益列)
# np.random.seed(42)
# date_rng = pd.date_range(start='2024-01-01', periods=250, freq='D')
# prices = 100 + np.cumsum(np.random.normal(0.1, 0.5, 250)) # 模拟股价
# log_returns = np.log(prices[1:]/prices[:-1]) # 计算对数收益率
# df = pd.DataFrame({
# 'Close': prices[1:], # 从第二天开始的价格
# '对数收益': log_returns
# }, index=date_rng[1:])
# 2. 计算关键统计指标
stats_dict = {
"均值": df['对数收益'].mean(),
"中位数": df['对数收益'].median(),
"标准差": df['对数收益'].std(),
"偏度": df['对数收益'].skew(), # 使用Pandas内置偏度计算
"峰度": df['对数收益'].kurtosis() # 使用Pandas内置峰度计算
}
# 使用Scipy验证计算结果(可选)
stats_dict_scipy = {
"偏度(scipy)": stats.skew(df['对数收益'].dropna()),
"峰度(scipy)": stats.kurtosis(df['对数收益'].dropna(), fisher=True)
}
# 3. 创建可视化图表(1行2列)
fig, axes = plt.subplots(1, 2, figsize=(14, 6), dpi=100)
# 直方图 + 密度曲线
sns.histplot(df['对数收益'], bins=25, kde=True, color='steelblue', ax=axes[0])
axes[0].axvline(stats_dict["均值"], color='red', linestyle='--', label=f'均值: {stats_dict["均值"]:.6f}')
axes[0].axvline(stats_dict["中位数"], color='green', linestyle='-.', label=f'中位数: {stats_dict["中位数"]:.6f}')
axes[0].set_title('对数收益率分布直方图', fontsize=14)
axes[0].set_xlabel('对数收益率', fontsize=12)
axes[0].set_ylabel('频率', fontsize=12)
axes[0].legend()
axes[0].grid(alpha=0.2)
# QQ图(正态概率图)
stats.probplot(df['对数收益'].dropna(), dist="norm", plot=axes[1])
axes[1].get_lines()[0].set_markerfacecolor('blue') # 设置数据点颜色
axes[1].get_lines()[0].set_markersize(5.0)
axes[1].get_lines()[1].set_color('red') # 设置参考线颜色
axes[1].set_title('对数收益率QQ图(正态检验)', fontsize=14)
axes[1].set_xlabel('理论分位数', fontsize=12)
axes[1].set_ylabel('样本分位数', fontsize=12)
axes[1].grid(alpha=0.2)
# 4. 添加统计信息文本框
stats_text = (
f"均值: {stats_dict['均值']:.6f}\n"
f"中位数: {stats_dict['中位数']:.6f}\n"
f"标准差: {stats_dict['标准差']:.6f}\n"
f"偏度: {stats_dict['偏度']:.4f}\n"
f"峰度: {stats_dict['峰度']:.4f}"
)
fig.text(0.92, 0.25, stats_text, fontsize=12,
bbox=dict(boxstyle='round', facecolor='wheat', alpha=0.5),
verticalalignment='top')
plt.tight_layout(rect=[0, 0, 0.85, 1]) # 为文本框留出空间
plt.savefig('log_returns_analysis.jpg', dpi=300)
plt.show()
# 5. 输出统计结果(表格形式)
stats_table = [
["统计指标", "值", "金融意义"],
["均值", f"{stats_dict['均值']:.6f}", "平均收益方向(正值为正收益)"],
["中位数", f"{stats_dict['中位数']:.6f}", "收益分布中心位置"],
["标准差", f"{stats_dict['标准差']:.6f}", "波动性/风险度量"],
["偏度", f"{stats_dict['偏度']:.4f}",
f"分布不对称性(>0 右偏,<0 左偏)\n当前: {'右偏' if stats_dict['偏度'] > 0 else '左偏'}"],
["峰度", f"{stats_dict['峰度']:.4f}",
f"尾部风险(>0 尖峰厚尾,<0 低峰薄尾)\n当前: {'尖峰厚尾' if stats_dict['峰度'] > 0 else '低峰薄尾'}"]
]
print("\n对数收益率描述性统计:")
print(tabulate(stats_table, headers="firstrow", tablefmt="fancy_grid"))
# 6. 输出正态性检验结果(Jarque-Bera检验)
jb_test = stats.jarque_bera(df['对数收益'].dropna())
print(f"\nJarque-Bera正态性检验:")
print(f"统计量: {jb_test[0]:.4f}, p值: {jb_test[1]:.4f}")
print("结论: " + ("拒绝正态性假设(非正态分布)" if jb_test[1] < 0.05 else "不能拒绝正态性假设"))
|

