1
2
3
4
5
6
7
8
9
10
11
12
13
14
15
16
17
18
19
20
21
22
23
24
25
26
27
28
29
30
31
32
33
34
35
36
37
38
39
40
41
42
43
44
45
46
47
48
49
50
51
52
53
54
55
56
57
58
59
60
61
62
63
64
65
66
67
68
69
70
71
72
73
74
75
76
77
78
79
| import pandas as pd
import numpy as np
import matplotlib.pyplot as plt
from statsmodels.tsa.seasonal import STL
# 确保数据没有缺失值(STL要求完整数据)
monthly_df = monthly_df.dropna(subset=['成交价'])
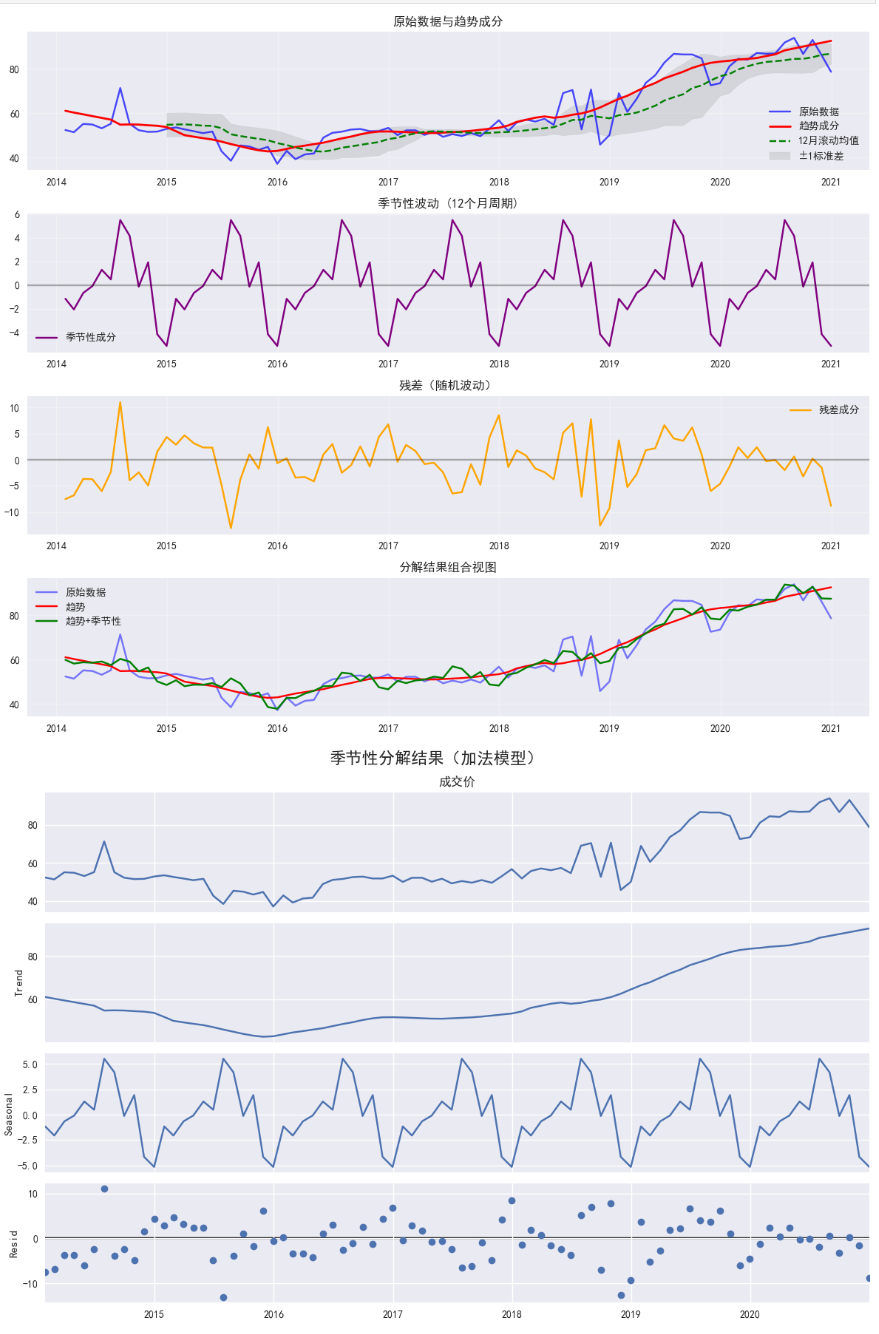
# 执行STL分解(加法模型)
stl = STL(monthly_df['成交价'], period=12) # 月度数据周期为12个月
result = stl.fit()
# 提取分解结果
trend = result.trend
seasonal = result.seasonal
residual = result.resid
# 创建专业级可视化图表
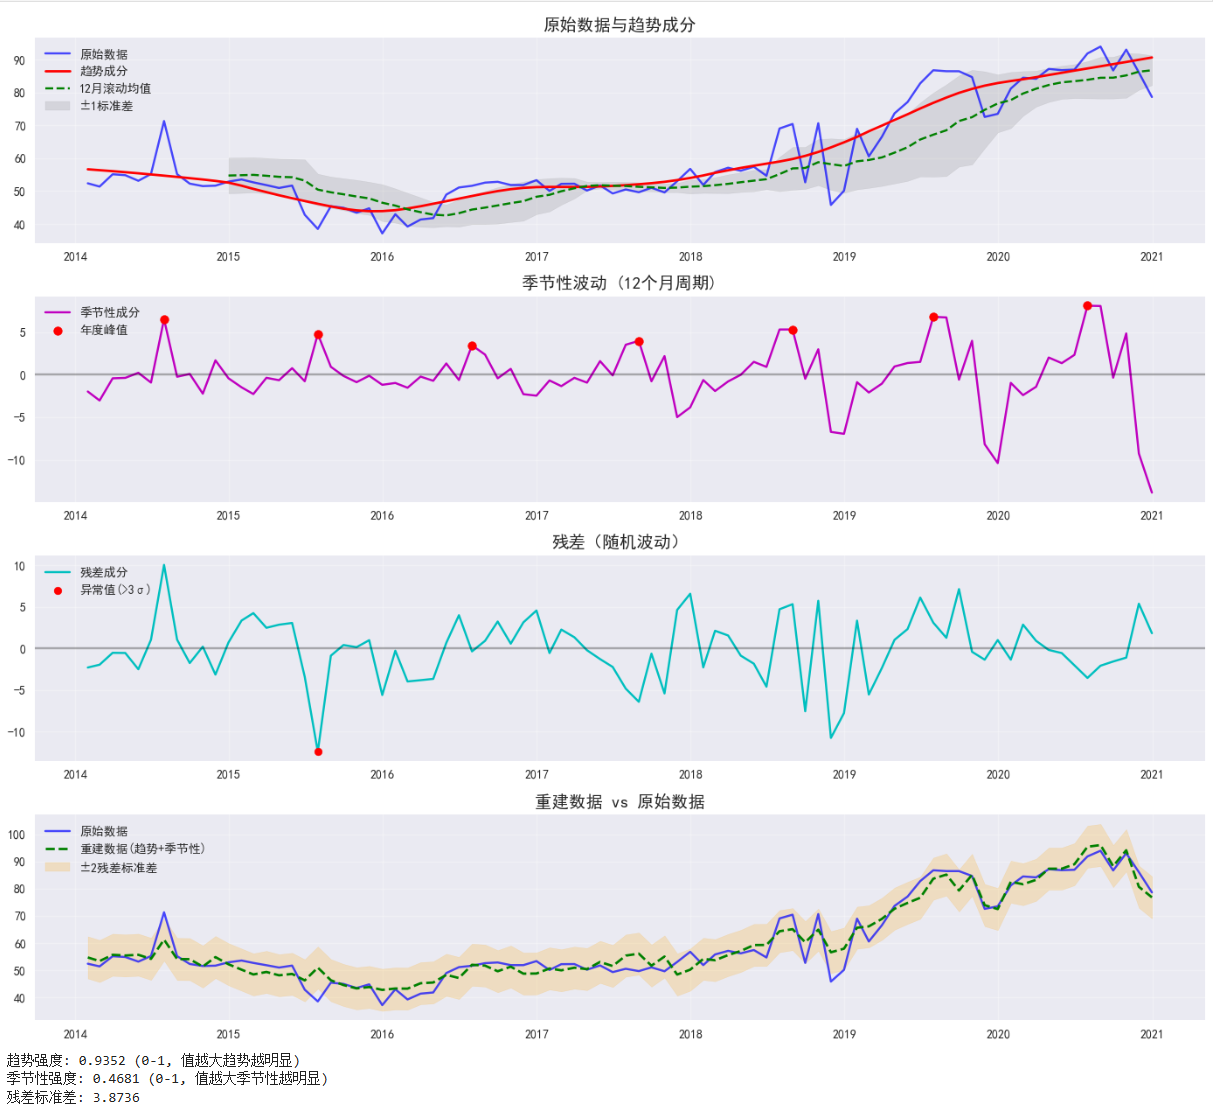
plt.figure(figsize=(14, 12))
# 1. 原始数据与趋势成分
plt.subplot(4, 1, 1)
plt.plot(monthly_df.index, monthly_df['成交价'], 'b-', label='原始数据', alpha=0.7)
plt.plot(trend.index, trend, 'r-', linewidth=2, label='趋势成分')
plt.plot(monthly_df.index, monthly_df['Rolling_Mean'], 'g--', label='12月滚动均值')
plt.fill_between(monthly_df.index,
monthly_df['Rolling_Mean'] - monthly_df['Rolling_Std'],
monthly_df['Rolling_Mean'] + monthly_df['Rolling_Std'],
color='gray', alpha=0.2, label='±1标准差')
plt.title('原始数据与趋势成分', fontsize=14)
plt.legend(loc='upper left')
plt.grid(alpha=0.3)
# 2. 季节性成分
plt.subplot(4, 1, 2)
plt.plot(seasonal.index, seasonal, 'm-', label='季节性成分')
# 标记季节性峰值
peak_idx = seasonal.groupby(seasonal.index.year).idxmax()
plt.scatter(peak_idx, seasonal.loc[peak_idx], color='red', s=50, zorder=5, label='年度峰值')
plt.axhline(y=0, color='k', linestyle='-', alpha=0.3)
plt.title('季节性波动 (12个月周期)', fontsize=14)
plt.legend(loc='upper left')
plt.grid(alpha=0.3)
# 3. 残差成分
plt.subplot(4, 1, 3)
plt.plot(residual.index, residual, 'c-', label='残差成分')
plt.axhline(y=0, color='k', linestyle='-', alpha=0.3)
# 标记异常残差(超过3个标准差)
std_resid = residual.std()
outliers = residual[np.abs(residual) > 3 * std_resid]
plt.scatter(outliers.index, outliers, color='red', s=40, zorder=5, label='异常值(>3σ)')
plt.title('残差(随机波动)', fontsize=14)
plt.legend(loc='upper left')
plt.grid(alpha=0.3)
# 4. 重建数据与原始数据对比
plt.subplot(4, 1, 4)
reconstructed = trend + seasonal # 趋势 + 季节性
plt.plot(monthly_df.index, monthly_df['成交价'], 'b-', label='原始数据', alpha=0.7)
plt.plot(reconstructed.index, reconstructed, 'g--', linewidth=2, label='重建数据(趋势+季节性)')
plt.fill_between(residual.index,
reconstructed - 2 * std_resid,
reconstructed + 2 * std_resid,
color='orange', alpha=0.2, label='±2残差标准差')
plt.title('重建数据 vs 原始数据', fontsize=14)
plt.legend(loc='upper left')
plt.grid(alpha=0.3)
plt.tight_layout()
plt.show()
# 计算并显示分解指标
trend_strength = max(0, 1 - residual.var() / (monthly_df['成交价'] - seasonal).var())
seasonal_strength = max(0, 1 - residual.var() / (monthly_df['成交价'] - trend).var())
print(f"趋势强度: {trend_strength:.4f} (0-1, 值越大趋势越明显)")
print(f"季节性强度: {seasonal_strength:.4f} (0-1, 值越大季节性越明显)")
print(f"残差标准差: {residual.std():.4f}")
|

