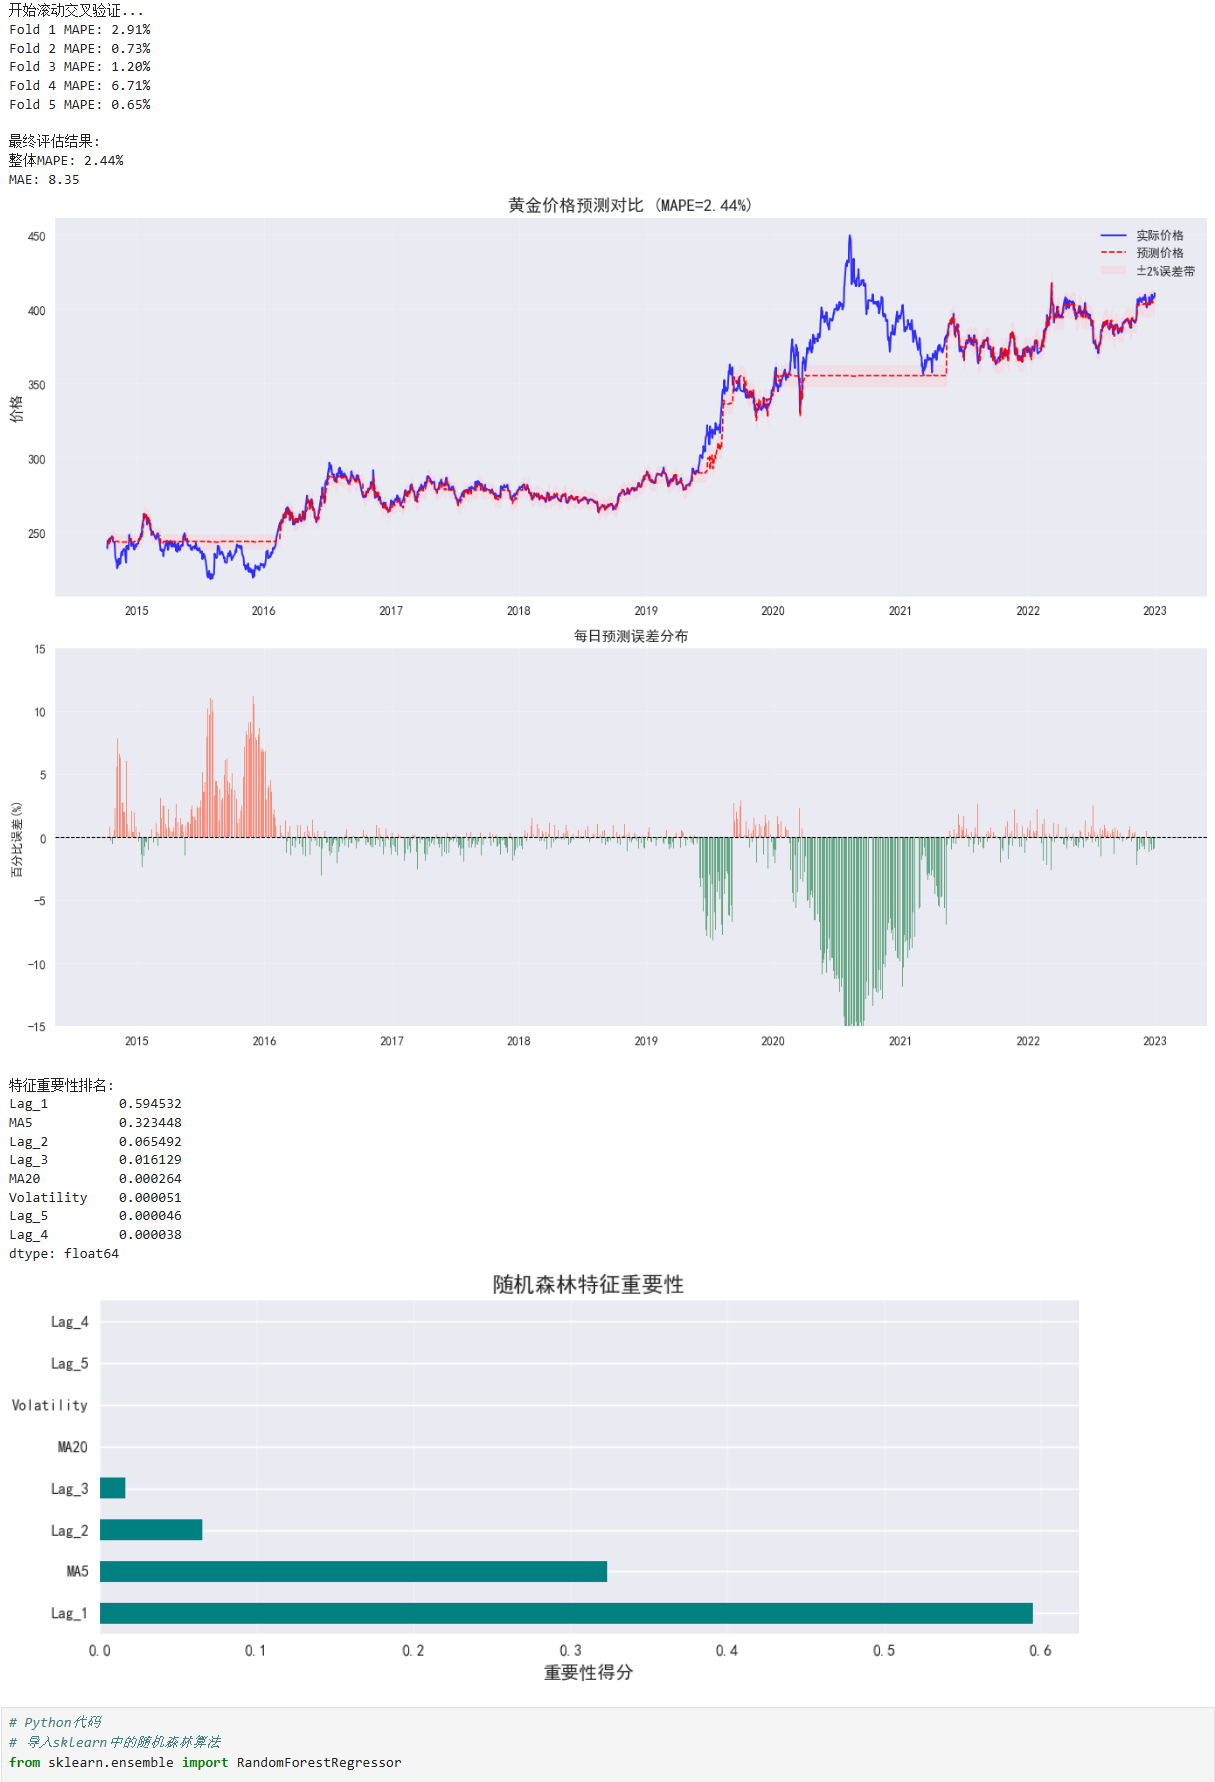
1
2
3
4
5
6
7
8
9
10
11
12
13
14
15
16
17
18
19
20
21
22
23
24
25
26
27
28
29
30
31
32
33
34
35
36
37
38
39
40
41
42
43
44
45
46
47
48
49
50
51
52
53
54
55
56
57
58
59
60
61
62
63
64
65
66
67
68
69
70
71
72
73
74
75
76
77
78
79
80
81
82
83
84
85
86
87
88
89
90
91
92
93
94
95
96
97
98
99
100
101
102
103
104
105
106
107
108
109
110
111
112
113
114
115
116
117
118
119
120
121
122
123
124
125
126
127
128
129
130
131
132
133
134
135
136
137
138
139
140
141
142
143
144
145
146
147
| import numpy as np
import pandas as pd
import matplotlib.pyplot as plt
from sklearn.ensemble import RandomForestRegressor
from sklearn.model_selection import TimeSeriesSplit
from sklearn.metrics import mean_absolute_error
# =====================
# 1. 数据准备与特征工程
# =====================
# 假设df是包含日期索引和收盘价的DataFrame
# 示例数据生成(替换为实际数据)
# dates = pd.date_range(start='2020-01-01', end='2025-06-27', freq='B') # 交易日
# prices = np.cumsum(np.random.randn(len(dates)) * 10 + 1800) # 模拟黄金价格
# df = pd.DataFrame({'收盘价': prices}, index=dates)
df = pd.read_excel('黄金连续.xlsx')
#将日期设置为index,并只保留收盘价
df.set_index('日期', inplace=True)
df = df[['收盘价']]
# 创建滞后特征(前1-5个交易日收盘价)
for lag in range(1, 6):
df[f'Lag_{lag}'] = df['收盘价'].shift(lag)
# 添加技术指标特征
df['MA5'] = df['收盘价'].rolling(5).mean().shift(1) # 5日移动平均(避免泄露)
df['MA20'] = df['收盘价'].rolling(20).mean().shift(1) # 20日移动平均
df['Volatility'] = df['收盘价'].pct_change().rolling(10).std().shift(1) # 波动率
# 目标变量(当日收盘价)
df['Target'] = df['收盘价']
# 删除包含NaN的行
df_clean = df.dropna().copy()
features = [f'Lag_{i}' for i in range(1, 6)] + ['MA5', 'MA20', 'Volatility']
# =====================
# 2. 滚动时间序列交叉验证
# =====================
tscv = TimeSeriesSplit(n_splits=5) # 5折时间序列分割[6](@ref)
predictions = []
actuals = []
dates_list = []
mape_values = []
print("开始滚动交叉验证...")
for fold, (train_index, test_index) in enumerate(tscv.split(df_clean)):
# 严格按时间顺序划分数据[2,5](@ref)
train_data = df_clean.iloc[train_index]
test_data = df_clean.iloc[test_index]
# 训练随机森林模型
model = RandomForestRegressor(
n_estimators=100,
max_depth=5,
random_state=42,
n_jobs=-1
)
model.fit(train_data[features], train_data['Target'])
# 预测并存储结果
fold_preds = model.predict(test_data[features])
predictions.extend(fold_preds)
actuals.extend(test_data['Target'].values)
dates_list.extend(test_data.index)
# 计算当前fold的MAPE(过滤零值)
mask = test_data['Target'] != 0
if sum(mask) > 0:
fold_mape = np.mean(np.abs((test_data.loc[mask, 'Target'] - fold_preds[mask]) /
test_data.loc[mask, 'Target'])) * 100
else:
fold_mape = 0
mape_values.append(fold_mape)
print(f"Fold {fold+1} MAPE: {fold_mape:.2f}%")
# =====================
# 3. 评估指标计算
# =====================
results = pd.DataFrame({
'Date': dates_list,
'Actual': actuals,
'Predicted': predictions
}).set_index('Date').sort_index()
# 整体MAPE计算(安全处理零值)
mask = results['Actual'] != 0
overall_mape = np.mean(np.abs((results.loc[mask, 'Actual'] - results.loc[mask, 'Predicted']) /
results.loc[mask, 'Actual'])) * 100
mae = mean_absolute_error(results['Actual'], results['Predicted'])
print("\n最终评估结果:")
print(f"整体MAPE: {overall_mape:.2f}%")
print(f"MAE: {mae:.2f}")
# =====================
# 4. 可视化分析
# =====================
plt.figure(figsize=(14, 10))
# 4.1 价格曲线对比
plt.subplot(2, 1, 1)
plt.plot(results.index, results['Actual'], 'b-', label='实际价格', alpha=0.8, lw=1.5)
plt.plot(results.index, results['Predicted'], 'r--', label='预测价格', lw=1.2)
plt.fill_between(results.index,
results['Predicted'] * 0.98,
results['Predicted'] * 1.02,
color='pink', alpha=0.3, label='±2%误差带')
plt.title(f'黄金价格预测对比 (MAPE={overall_mape:.2f}%)', fontsize=14)
plt.ylabel('价格', fontsize=12)
plt.legend()
plt.grid(alpha=0.2)
# 4.2 误差分布分析
plt.subplot(2, 1, 2)
errors = (results['Predicted'] - results['Actual']) / results['Actual'] * 100
plt.bar(results.index, errors,
color=np.where(errors >= 0, 'tomato', 'seagreen'),
alpha=0.7, width=1)
plt.axhline(0, color='black', ls='--', lw=0.8)
plt.title('每日预测误差分布', fontsize=12)
plt.ylabel('百分比误差(%)', fontsize=10)
plt.ylim(-15, 15)
plt.grid(alpha=0.2)
plt.tight_layout()
plt.savefig('gold_price_forecast.png', dpi=300)
plt.show()
# 4.3 特征重要性分析
feature_importance = pd.Series(
model.feature_importances_,
index=features
).sort_values(ascending=False)
print("\n特征重要性排名:")
print(feature_importance)
plt.figure(figsize=(10, 4))
feature_importance.plot(kind='barh', color='teal')
plt.title('随机森林特征重要性', fontsize=14)
plt.xlabel('重要性得分', fontsize=12)
plt.grid(axis='x', alpha=0.3)
plt.tight_layout()
plt.show()
|

