1
2
3
4
5
6
7
8
9
10
11
12
13
14
15
16
17
18
19
20
21
22
23
24
25
26
27
28
29
30
31
32
33
34
35
36
37
38
39
40
41
42
43
44
45
46
47
48
49
50
51
52
53
54
55
56
57
58
59
60
61
62
63
64
65
66
67
68
69
70
71
72
73
74
75
76
77
78
79
80
81
82
83
84
85
86
87
88
89
90
91
92
93
94
95
96
97
98
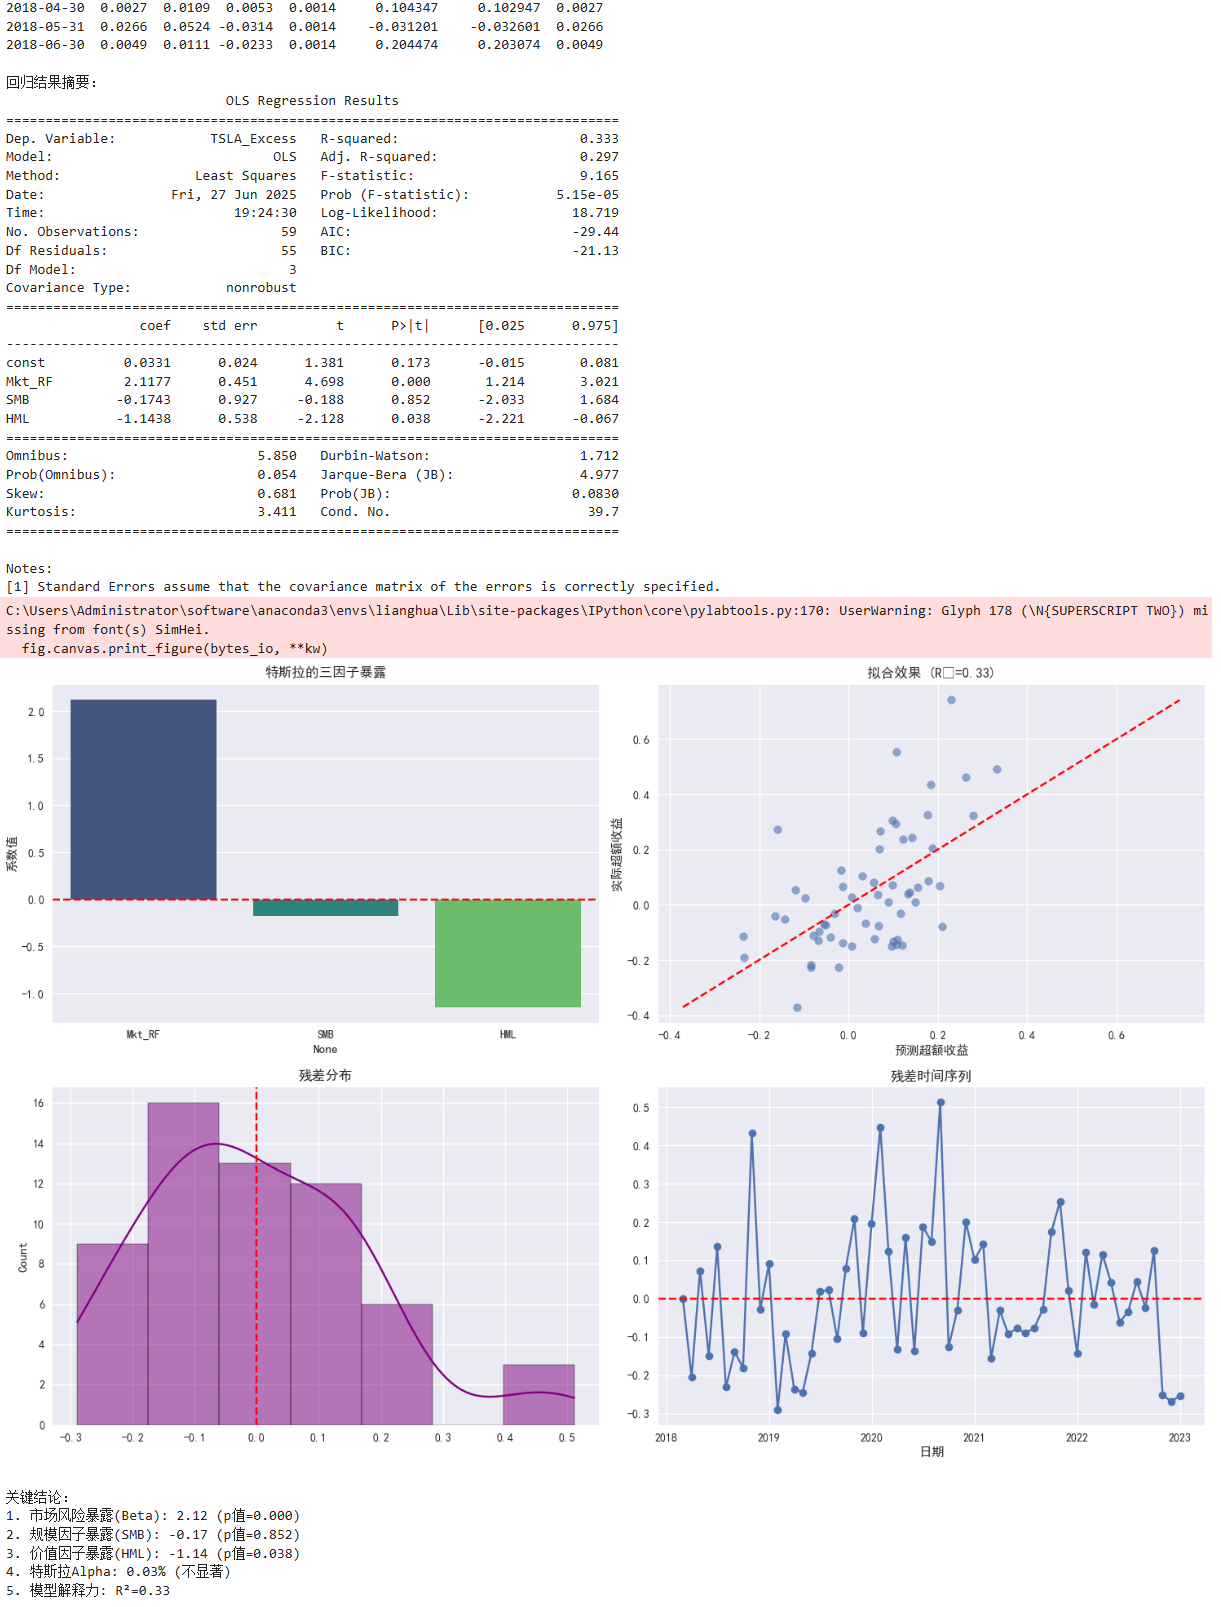
| import pandas as pd
import numpy as np
import statsmodels.api as sm
import matplotlib.pyplot as plt
import seaborn as sns
# 1. 数据准备与预处理
# 假设已有两个DataFrame:
# factors_df: 月度三因子数据,包含日期索引和列['Mkt_RF','SMB','HML','RF']
# tsla_df: 特斯拉日频数据,包含日期索引和列['adj_close']
# 将日频股价转换为月度收益率 (使用月末最后一天)
tsla_monthly = tsla['Adj Close'].resample('M').last() # 获取每月最后一天收盘价
ff_df = ff_df.resample('M').last().div(100)
tsla_returns = tsla_monthly.pct_change().dropna()
tsla_returns.name = 'TSLA_Return'
# 合并因子数据与股票收益 (按月份对齐)
merged_data = pd.merge(
ff_df,
tsla_returns,
left_index=True,
right_index=True,
how='inner'
)
# 2. 计算超额收益
merged_data['TSLA_Excess'] = merged_data['TSLA_Return'] - merged_data['RF']
merged_data['Mkt_RF'] = merged_data['Mkt-RF'] # 市场超额收益已包含无风险调整
# 检查数据
print("前5个月度数据样本:")
print(merged_data.head())
# 3. 三因子模型回归
X = merged_data[['Mkt_RF', 'SMB', 'HML']] # 自变量:三因子
y = merged_data['TSLA_Excess'] # 因变量:特斯拉超额收益
X = sm.add_constant(X) # 添加截距项
# 拟合OLS模型
model = sm.OLS(y, X)
results = model.fit()
# 4. 输出回归结果
print("\n回归结果摘要:")
print(results.summary())
# 5. 可视化分析
plt.figure(figsize=(15, 10))
# 5.1 因子系数可视化
plt.subplot(2, 2, 1)
coefs = results.params.drop('const')
sns.barplot(x=coefs.index, y=coefs.values, palette='viridis')
plt.axhline(0, color='red', linestyle='--')
plt.title('特斯拉的三因子暴露')
plt.ylabel('系数值')
# 5.2 实际vs预测值
plt.subplot(2, 2, 2)
plt.scatter(results.fittedvalues, y, alpha=0.6)
plt.plot([y.min(), y.max()], [y.min(), y.max()], 'r--')
plt.xlabel('预测超额收益')
plt.ylabel('实际超额收益')
plt.title(f'拟合效果 (R²={results.rsquared:.2f})')
# 5.3 残差分布
plt.subplot(2, 2, 3)
sns.histplot(results.resid, kde=True, color='purple')
plt.axvline(0, color='red', linestyle='--')
plt.title('残差分布')
# 5.4 时间序列残差
plt.subplot(2, 2, 4)
plt.plot(merged_data.index, results.resid, 'o-')
plt.axhline(0, color='red', linestyle='--')
plt.title('残差时间序列')
plt.xlabel('日期')
plt.tight_layout()
plt.savefig('tesla_three_factor_results.png', dpi=300)
plt.show()
# 6. 结果解读
alpha = results.params['const']
alpha_pval = results.pvalues['const']
print("\n关键结论:")
print(f"1. 市场风险暴露(Beta): {results.params['Mkt_RF']:.2f} (p值={results.pvalues['Mkt_RF']:.3f})")
print(f"2. 规模因子暴露(SMB): {results.params['SMB']:.2f} (p值={results.pvalues['SMB']:.3f})")
print(f"3. 价值因子暴露(HML): {results.params['HML']:.2f} (p值={results.pvalues['HML']:.3f})")
print(f"4. 特斯拉Alpha: {alpha:.2f}% {'(显著)' if alpha_pval < 0.05 else '(不显著)'}")
print(f"5. 模型解释力: R²={results.rsquared:.2f}")
if alpha > 0 and alpha_pval < 0.05:
print("→ 特斯拉持续产生显著的正超额收益")
elif alpha < 0 and alpha_pval < 0.05:
print("→ 特斯拉持续产生显著的负超额收益")
|

