1
2
3
4
5
6
7
8
9
10
11
12
13
14
15
16
17
18
19
20
21
22
23
24
25
26
27
28
29
30
31
32
33
34
35
36
37
38
39
40
41
42
43
44
45
46
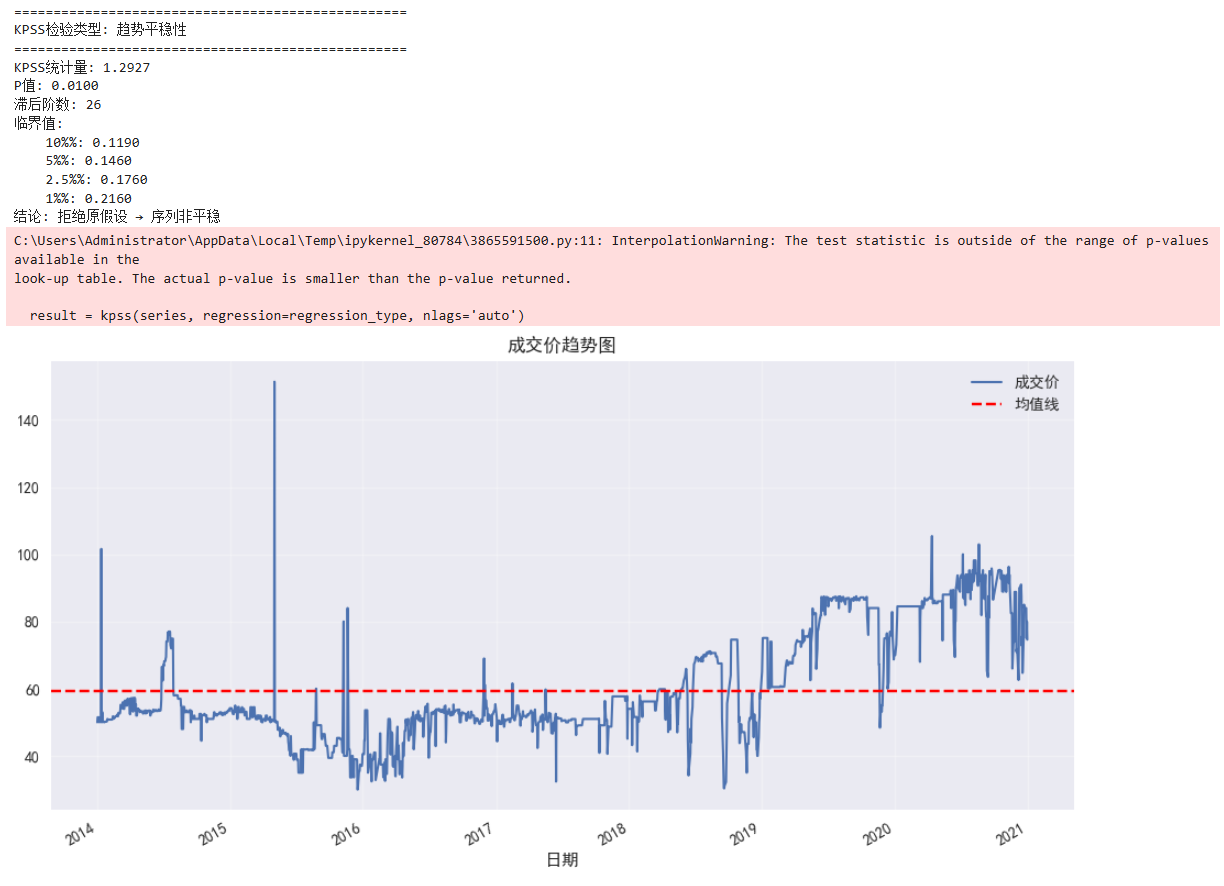
| from statsmodels.tsa.stattools import kpss
import matplotlib.pyplot as plt
# KPSS检验函数(增强版)
def kpss_test(series, regression_type='ct'):
"""
执行KPSS检验并返回格式化结果
:param series: 时间序列数据
:param regression_type: 'c'(仅常数项)或 'ct'(常数项+趋势项)
"""
result = kpss(series, regression=regression_type, nlags='auto')
# 解析结果
statistic = result[0]
p_value = result[1]
lags = result[2]
critical_values = result[3]
# 输出结果
print('='*50)
print(f'KPSS检验类型: {"趋势平稳性" if regression_type=="ct" else "水平平稳性"}')
print('='*50)
print(f'KPSS统计量: {statistic:.4f}')
print(f'P值: {p_value:.4f}')
print(f'滞后阶数: {lags}')
print('临界值:')
for key, value in critical_values.items():
print(f' {key}%: {value:.4f}')
# 结论判断
if p_value < 0.05:
print("结论: 拒绝原假设 → 序列非平稳")
else:
print("结论: 无法拒绝原假设 → 序列平稳")
# 执行KPSS检验(推荐使用趋势平稳性检验)
kpss_test(df['成交价'], regression_type='ct') # 金融数据通常需检验趋势平稳性
# kpss_test(df['成交价'], regression_type='c') # 水平平稳性
# 可视化辅助判断
plt.figure(figsize=(12, 6))
df['成交价'].plot(title='成交价趋势图', lw=1.5)
plt.axhline(y=df['成交价'].mean(), color='r', linestyle='--', label='均值线')
plt.grid(alpha=0.3)
plt.legend()
plt.show()
|

