1
2
3
4
5
6
7
8
9
10
11
12
13
14
15
16
17
18
19
20
21
22
23
24
25
26
27
28
29
30
31
32
33
34
35
36
37
38
39
40
41
42
43
44
45
46
47
48
49
50
51
52
53
54
55
56
57
58
59
60
61
62
63
64
65
66
67
68
69
70
71
72
73
74
75
76
77
78
79
80
81
82
83
84
85
86
87
88
89
90
91
92
93
94
95
96
97
98
99
100
101
102
103
104
105
106
107
108
109
110
111
112
113
114
115
116
117
118
119
120
121
122
123
124
125
126
| import pandas as pd
import numpy as np
import matplotlib.pyplot as plt
from sklearn.linear_model import LinearRegression
from sklearn.model_selection import TimeSeriesSplit
from sklearn.metrics import mean_absolute_error
# 1. 特征工程扩展(添加滞后特征)
for lag in [1, 3, 5, 7]:
df[f'Lag_{lag}'] = df['收盘价'].shift(lag)
# 添加技术指标特征
df['MA5'] = df['收盘价'].rolling(5).mean().shift(1) # 5日移动平均(避免泄露)
df['MA20'] = df['收盘价'].rolling(20).mean().shift(1) # 20日移动平均
df['Volatility'] = df['收盘价'].rolling(10).std().shift(1) # 波动率
df['Price_Change'] = df['收盘价'].pct_change().shift(1) * 100 # 价格变化率
# 目标变量(预测次日收盘价)
df['Target'] = df['收盘价'].shift(-1)
# 删除含NaN的行
df_clean = df.dropna().copy()
# 2. 定义特征和目标变量
features = [col for col in df_clean.columns if col not in ['收盘价', 'Target', 'Month']]
target = 'Target'
# 3. 滚动时间序列交叉验证
tscv = TimeSeriesSplit(n_splits=5)
predictions = []
actuals = []
dates = []
mape_values = []
print("开始滚动交叉验证...")
for train_index, test_index in tscv.split(df_clean):
# 数据分割
train = df_clean.iloc[train_index]
test = df_clean.iloc[test_index]
# 训练模型
model = LinearRegression()
model.fit(train[features], train[target])
# 预测
test_pred = model.predict(test[features])
# 存储结果
predictions.extend(test_pred)
actuals.extend(test[target].values)
dates.extend(test.index)
# 计算MAPE(过滤零值)
mask = test[target] != 0
mape = mean_absolute_error(
test.loc[mask, target],
test_pred[mask]
) / np.mean(test.loc[mask, target]) * 100
mape_values.append(mape)
print(f"子集MAPE: {mape:.2f}%")
# 4. 结果汇总
results = pd.DataFrame({
'Date': dates,
'Actual': actuals,
'Predicted': predictions
}).set_index('Date').sort_index()
# 整体MAPE计算
mask = results['Actual'] != 0
overall_mape = mean_absolute_error(
results.loc[mask, 'Actual'],
results.loc[mask, 'Predicted']
) / np.mean(results.loc[mask, 'Actual']) * 100
print(f"\n整体MAPE: {overall_mape:.2f}%")
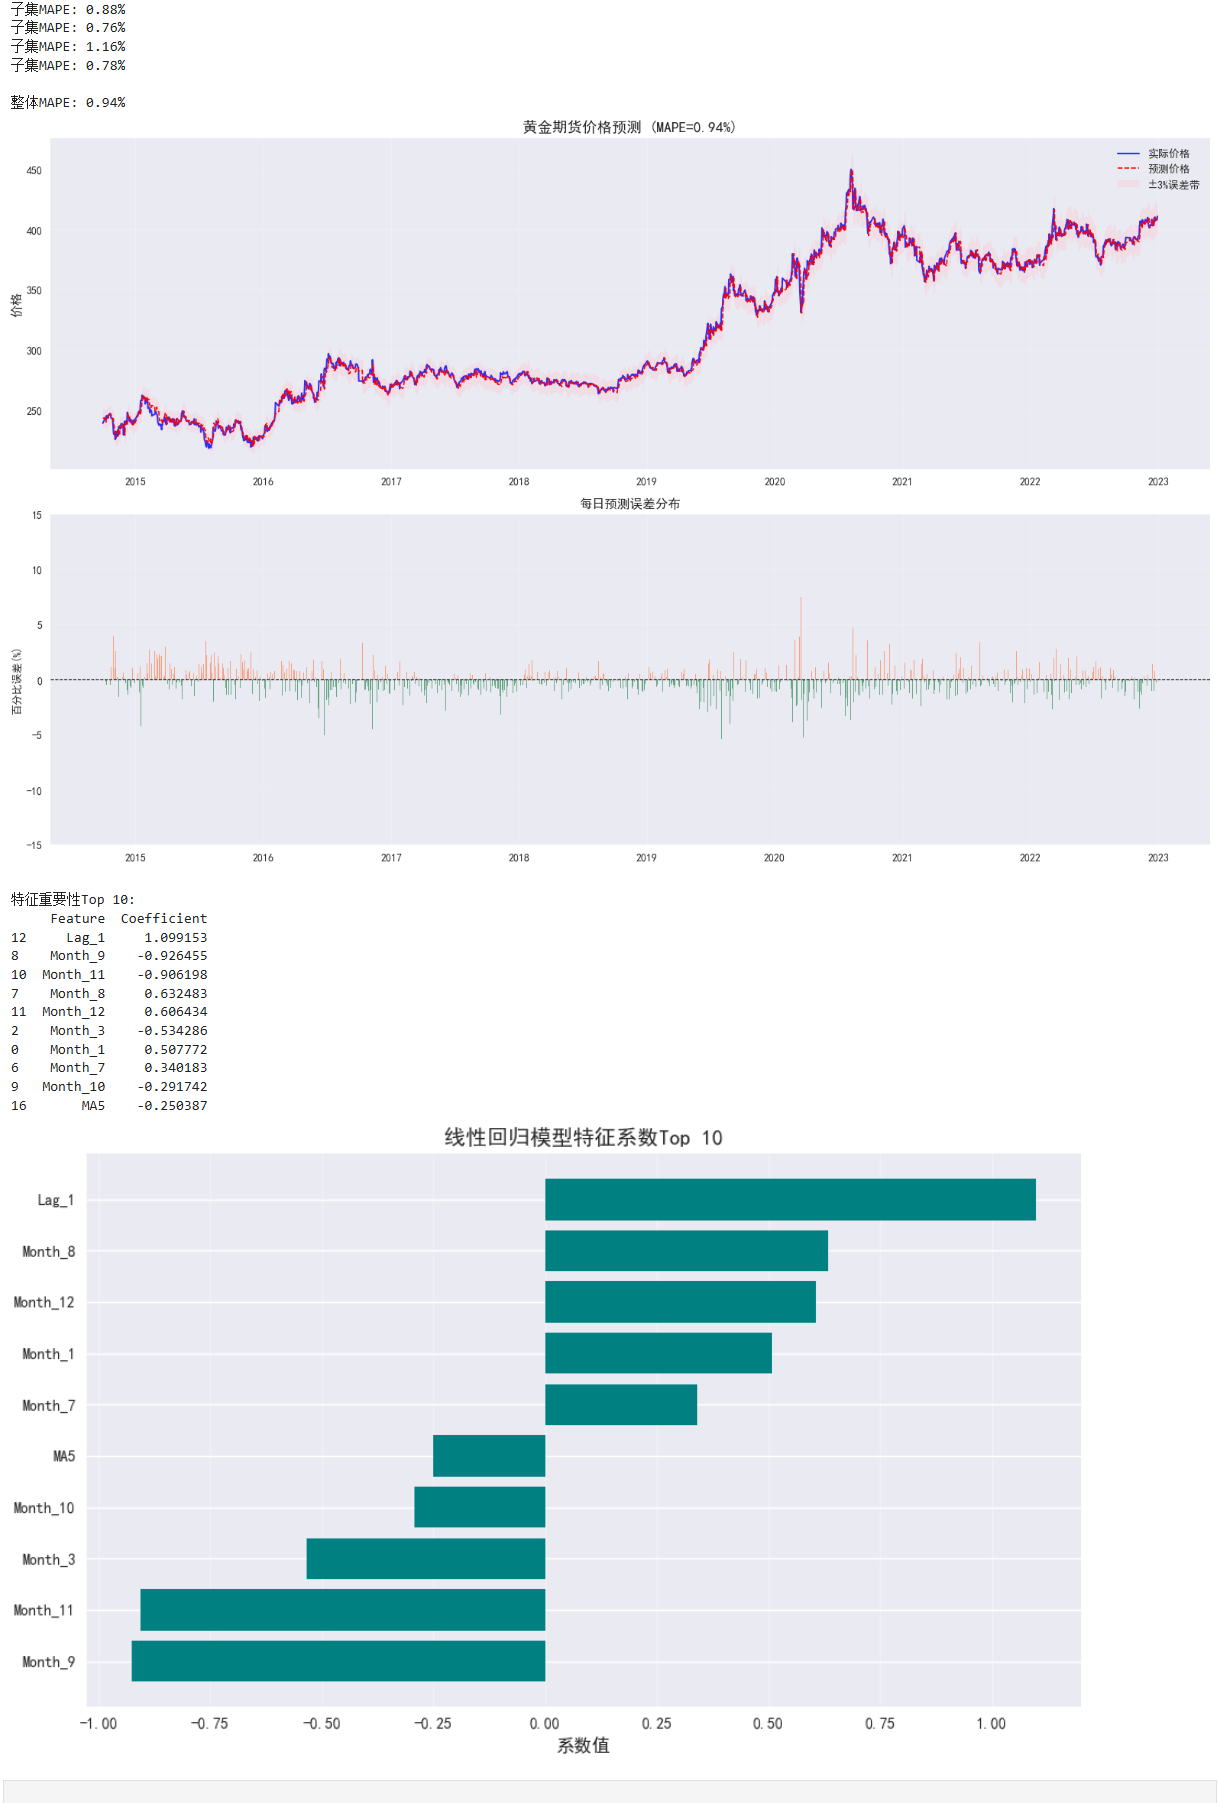
# 5. 可视化分析
plt.figure(figsize=(16, 10))
# 5.1 价格曲线对比
plt.subplot(2, 1, 1)
plt.plot(results.index, results['Actual'], 'b-', label='实际价格', alpha=0.8, lw=1.5)
plt.plot(results.index, results['Predicted'], 'r--', label='预测价格', lw=1.2)
plt.fill_between(results.index,
results['Predicted'] * 0.97,
results['Predicted'] * 1.03,
color='pink', alpha=0.3, label='±3%误差带')
plt.title(f'黄金期货价格预测 (MAPE={overall_mape:.2f}%)', fontsize=14)
plt.ylabel('价格', fontsize=12)
plt.legend()
plt.grid(alpha=0.2)
# 5.2 误差分布分析
plt.subplot(2, 1, 2)
errors = (results['Predicted'] - results['Actual']) / results['Actual'] * 100
plt.bar(results.index, errors,
color=np.where(errors >= 0, 'coral', 'seagreen'),
alpha=0.7, width=0.8)
plt.axhline(0, color='black', ls='--', lw=0.8)
plt.title('每日预测误差分布', fontsize=12)
plt.ylabel('百分比误差(%)', fontsize=10)
plt.ylim(-15, 15)
plt.grid(alpha=0.2)
plt.tight_layout()
plt.savefig('gold_price_forecast.png', dpi=300)
plt.show()
# 6. 模型系数分析
coef_df = pd.DataFrame({
'Feature': features,
'Coefficient': model.coef_
}).sort_values('Coefficient', key=abs, ascending=False)
print("\n特征重要性Top 10:")
print(coef_df.head(10))
# 可视化系数
plt.figure(figsize=(10, 6))
top_features = coef_df.head(10).sort_values('Coefficient', ascending=True)
plt.barh(top_features['Feature'], top_features['Coefficient'], color='teal')
plt.title('线性回归模型特征系数Top 10', fontsize=14)
plt.xlabel('系数值', fontsize=12)
plt.grid(axis='x', alpha=0.3)
plt.tight_layout()
plt.show()
|


