1
2
3
4
5
6
7
8
9
10
11
12
13
14
15
16
17
18
19
20
21
22
23
24
25
26
27
28
29
30
31
32
33
34
35
36
37
38
39
40
41
42
43
44
45
46
47
48
49
50
51
52
53
54
55
56
57
58
59
60
61
62
63
64
65
66
67
68
69
70
71
72
73
74
75
76
77
78
79
80
81
82
83
84
85
86
87
88
89
90
91
92
93
94
95
96
97
98
99
100
101
102
103
104
105
106
107
108
109
110
111
112
113
114
115
116
117
118
119
120
121
122
123
124
125
126
127
128
129
130
131
132
133
134
135
136
137
138
139
140
141
142
| import numpy as np
import matplotlib.pyplot as plt
from sklearn.linear_model import LinearRegression
from scipy.stats import norm
class AmericanOptionLSMC:
def __init__(self, S0, K, T, r, sigma, n_paths=50000, n_steps=100, option_type='put'):
self.S0 = S0 # 初始股价
self.K = K # 行权价
self.T = T # 到期时间(年)
self.r = r # 无风险利率
self.sigma = sigma # 波动率
self.n_paths = n_paths # 模拟路径数
self.n_steps = n_steps # 时间步数
self.option_type = option_type.lower() # 期权类型(call/put)
self.dt = T / n_steps # 单步时间长度
self.discount = np.exp(-r * self.dt) # 单步贴现因子
def _generate_paths(self):
"""生成几何布朗运动价格路径[3,9](@ref)"""
paths = np.zeros((self.n_steps + 1, self.n_paths))
paths[0] = self.S0
for t in range(1, self.n_steps + 1):
z = np.random.standard_normal(self.n_paths) # 随机数
paths[t] = paths[t-1] * np.exp(
(self.r - 0.5 * self.sigma**2) * self.dt +
self.sigma * np.sqrt(self.dt) * z
)
return paths
def _calculate_payoff(self, S):
"""计算即时行权收益[5](@ref)"""
if self.option_type == 'call':
return np.maximum(S - self.K, 0)
else: # put
return np.maximum(self.K - S, 0)
def _lsm_pricing(self, paths):
"""最小二乘蒙特卡洛核心算法[3,5](@ref)"""
# 初始化现金流矩阵(最后时刻收益)
cash_flows = self._calculate_payoff(paths[-1])
exercise_matrix = np.zeros_like(cash_flows) # 记录最优行权时刻
# 从到期前一步开始回溯
for t in range(self.n_steps - 1, 0, -1):
S_t = paths[t]
in_the_money = self._calculate_payoff(S_t) > 0 # 实值路径索引
if np.sum(in_the_money) > 0:
# 继续持有价值 = 未来现金流贴现均值
continuation_value = cash_flows * self.discount ** (self.n_steps - t)
# 回归估计条件期望函数(使用二次多项式)[3](@ref)
X = S_t[in_the_money].reshape(-1, 1)
Y = continuation_value[in_the_money]
reg = LinearRegression()
reg.fit(np.column_stack([X, X**2]), Y) # 特征: [S, S^2]
estimated_cont_value = reg.predict(np.column_stack([X, X**2]))
# 比较立即行权与持有价值
immediate_exercise = self._calculate_payoff(S_t[in_the_money])
exercise_now = immediate_exercise > estimated_cont_value
# 更新现金流和行权标记
cash_flows[in_the_money] = np.where(
exercise_now,
immediate_exercise,
continuation_value[in_the_money]
)
exercise_matrix[in_the_money] = np.where(
exercise_now,
t,
exercise_matrix[in_the_money]
)
# 计算期权现值(所有路径贴现均值)
present_values = cash_flows * np.exp(-self.r * self.dt * exercise_matrix)
return np.mean(present_values), exercise_matrix
def price(self):
"""主定价函数"""
paths = self._generate_paths()
price, exercise_matrix = self._lsm_pricing(paths)
# 计算欧式期权价格对比[9](@ref)
european_price = self._european_option_price()
return price, european_price, paths, exercise_matrix
def _european_option_price(self):
"""欧式期权解析解(BSM模型)[9](@ref)"""
d1 = (np.log(self.S0 / self.K) + (self.r + 0.5 * self.sigma**2) * self.T) / (self.sigma * np.sqrt(self.T))
d2 = d1 - self.sigma * np.sqrt(self.T)
if self.option_type == 'call':
return self.S0 * norm.cdf(d1) - self.K * np.exp(-self.r * self.T) * norm.cdf(d2)
else:
return self.K * np.exp(-self.r * self.T) * norm.cdf(-d2) - self.S0 * norm.cdf(-d1)
# 示例使用
if __name__ == "__main__":
# 参数设置
params = {
'S0': 100, # 初始股价
'K': 105, # 行权价
'T': 1, # 到期时间(年)
'r': 0.05, # 无风险利率
'sigma': 0.2, # 波动率
'n_paths': 10000, # 路径数量(实际应用需>50,000)
'n_steps': 50, # 时间步数
'option_type': 'call' # 期权类型
}
# 定价计算
lsmc = AmericanOptionLSMC(**params)
american_price, european_price, paths, exercise_matrix = lsmc.price()
# 结果输出
print(f"美式{params['option_type']}期权价格: {american_price:.4f}")
print(f"欧式{params['option_type']}期权价格: {european_price:.4f}")
print(f"提前行权溢价: {american_price - european_price:.4f}")
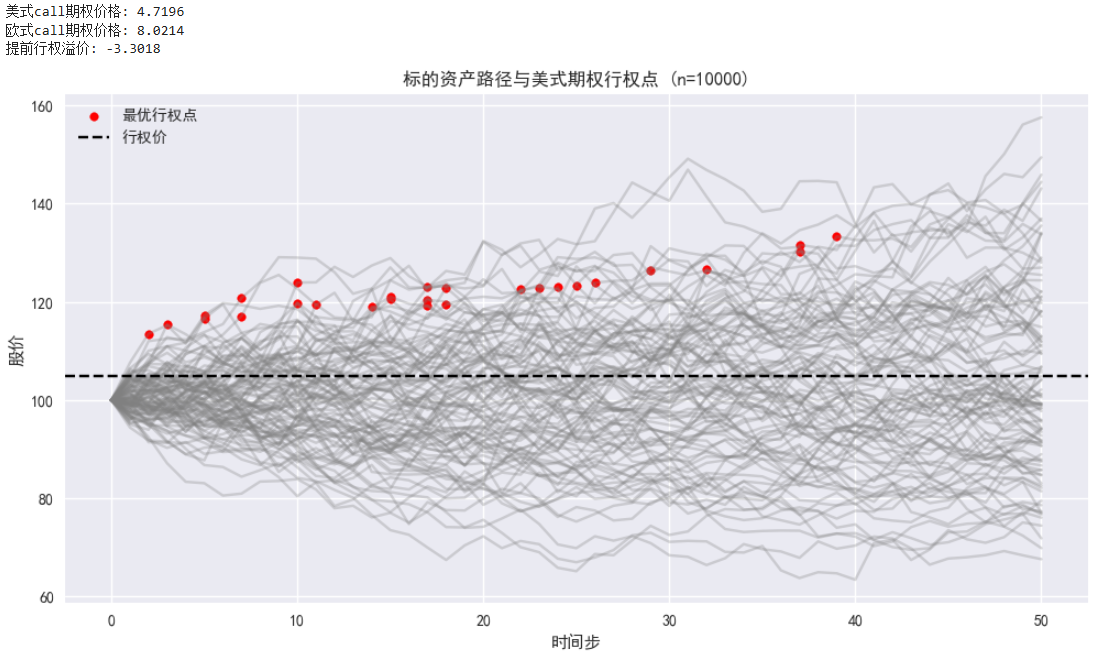
# 可视化路径与行权点
plt.figure(figsize=(12, 6))
for i in range(100): # 展示100条路径
plt.plot(paths[:, i], color='gray', alpha=0.3)
# 标记最优行权点
exercise_points = []
for path_idx in range(100):
t = int(exercise_matrix[path_idx])
if t > 0: # 排除未提前行权路径
exercise_points.append((t, paths[t, path_idx]))
if exercise_points:
t_vals, s_vals = zip(*exercise_points)
plt.scatter(t_vals, s_vals, color='red', s=30, label='最优行权点')
plt.axhline(y=params['K'], color='black', linestyle='--', label='行权价')
plt.title(f"标的资产路径与美式期权行权点 (n={params['n_paths']})")
plt.xlabel('时间步')
plt.ylabel('股价')
plt.legend()
plt.show()
|

