1
2
3
4
5
6
7
8
9
10
11
12
13
14
15
16
17
18
19
20
21
22
23
24
25
26
27
28
29
30
31
32
33
34
35
36
37
38
39
40
41
42
43
44
45
46
47
48
49
50
51
52
53
54
55
56
57
58
59
60
61
62
63
64
65
66
67
68
69
70
71
72
73
74
75
76
77
78
79
80
81
82
83
84
85
86
87
| import pandas as pd
import matplotlib.pyplot as plt
import numpy as np
# 计算20日均线
price['short_mavg'] = price['收盘'].rolling(window=20, min_periods=1).mean()
# 生成交易信号 (收盘价上穿20日均线买入,否则卖出)
price['signal'] = 0.0
price['signal'] = np.where(price['收盘'] > price['short_mavg'], 1.0, 0.0)
# 计算每日收益
price['daily_returns'] = price['收盘'].pct_change()
# ===== 添加交易成本计算 =====
# 计算仓位变化 (信号变化时产生交易)
price['position_change'] = price['signal'].diff().abs()
# 计算交易成本 (0.5%的单向费率)
price['trading_cost'] = price['position_change'] * 0.005
# 计算策略收益 (扣除交易成本)
price['strategy_returns'] = price['daily_returns'] * price['signal'].shift(1) - price['trading_cost']
# 计算被动持有收益 (无交易成本)
price['benchmark_returns'] = price['daily_returns']
# ===== 计算累积收益 =====
# 策略累积收益 (考虑交易成本)
price['cumulative_strategy_returns'] = (1 + price['strategy_returns']).cumprod()
# 被动持有累积收益
price['cumulative_benchmark_returns'] = (1 + price['benchmark_returns']).cumprod()
# ===== 可视化对比 =====
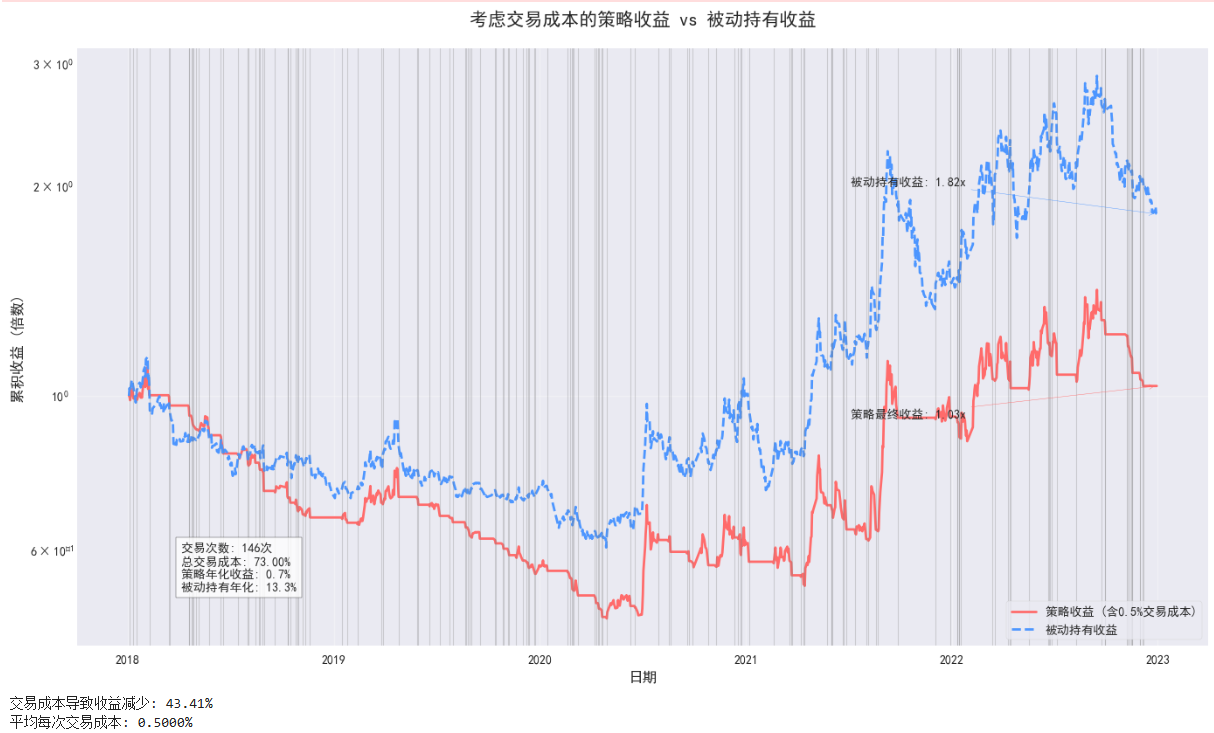
plt.figure(figsize=(14, 8), dpi=100)
plt.grid(True, alpha=0.3)
# 绘制累积收益曲线
plt.plot(price.index, price['cumulative_strategy_returns'],
label='策略收益 (含0.5%交易成本)', lw=2, color='#FF6B6B')
plt.plot(price.index, price['cumulative_benchmark_returns'],
label='被动持有收益', ls='--', lw=2, color='#4D96FF')
# 标记交易点
trade_dates = price[price['position_change'] > 0].index
for date in trade_dates:
plt.axvline(x=date, color='gray', alpha=0.3, lw=0.8)
# 添加最终收益标注
final_strategy = price['cumulative_strategy_returns'].iloc[-1]
final_benchmark = price['cumulative_benchmark_returns'].iloc[-1]
plt.annotate(f'策略最终收益: {final_strategy:.2f}x',
xy=(price.index[-1], final_strategy),
xytext=(price.index[-int(len(price)*0.3)], final_strategy*0.9),
arrowprops=dict(arrowstyle='->', color='#FF6B6B'))
plt.annotate(f'被动持有收益: {final_benchmark:.2f}x',
xy=(price.index[-1], final_benchmark),
xytext=(price.index[-int(len(price)*0.3)], final_benchmark*1.1),
arrowprops=dict(arrowstyle='->', color='#4D96FF'))
# 添加统计信息
trade_count = len(trade_dates)
total_cost = price['trading_cost'].sum() * 100
plt.figtext(0.15, 0.15,
f"交易次数: {trade_count}次\n总交易成本: {total_cost:.2f}%\n"
f"策略年化收益: {final_strategy**(252/len(price))-1:.1%}\n"
f"被动持有年化: {final_benchmark**(252/len(price))-1:.1%}",
bbox=dict(facecolor='white', alpha=0.8))
# 设置图表元素
plt.title('考虑交易成本的策略收益 vs 被动持有收益', fontsize=15, pad=20)
plt.xlabel('日期', fontsize=12)
plt.ylabel('累积收益 (倍数)', fontsize=12)
plt.legend(loc='best', frameon=True)
plt.yscale('log') # 对数刻度更好展示长期收益
plt.tight_layout()
plt.savefig('考虑交易成本的收益对比.jpg', dpi=300, bbox_inches='tight')
plt.show()
# ===== 额外分析:交易成本影响 =====
cost_impact = (final_benchmark - final_strategy) / final_benchmark * 100
print(f"交易成本导致收益减少: {cost_impact:.2f}%")
print(f"平均每次交易成本: {total_cost/trade_count:.4f}%")
|

