1
2
3
4
5
6
7
8
9
10
11
12
13
14
15
16
17
18
19
20
21
22
23
24
25
26
27
28
29
30
31
32
33
34
35
| import pandas as pd
import numpy as np
import matplotlib.pyplot as plt
# 1. 数据加载(假设已存在merged_df)
merged_df = pd.read_excel('../数据/资产配置实验数据.xlsx', index_col='日期')
# 2. 计算各股票日收益率
returns = merged_df.pct_change() # 简单收益率:(今日价-昨日价)/昨日价[1,5](@ref)
returns = returns.fillna(0) # 首日收益率填充为0
# 3. 设置等权重(四只股票各25%)
weights = np.array([0.25, 0.25, 0.25, 0.25]) # 等权重组合[1,7](@ref)
# 4. 计算组合每日收益率
portfolio_returns = returns.dot(weights) # 矩阵乘法计算组合收益[1,8](@ref)
# 5. 计算累计收益率(可选)
cumulative_returns = (1 + portfolio_returns).cumprod() - 1
# 6. 结果展示
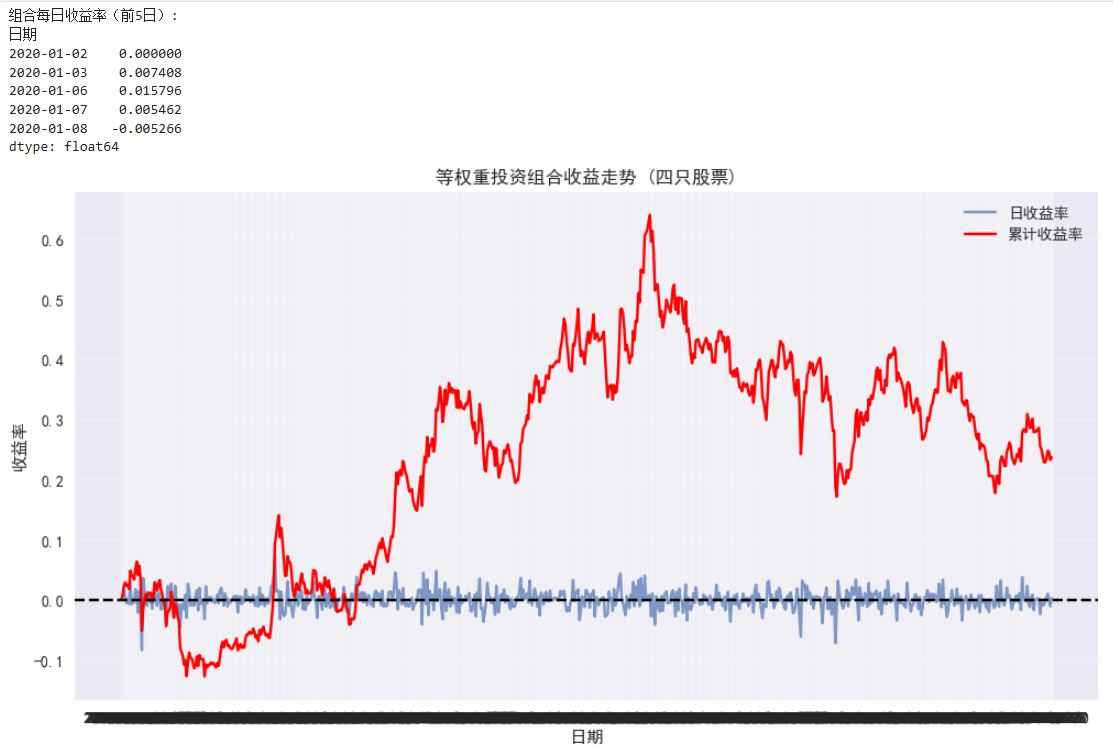
print("组合每日收益率(前5日):")
print(portfolio_returns.head())
# 7. 可视化
plt.figure(figsize=(12, 6))
plt.plot(portfolio_returns.index, portfolio_returns, label='日收益率', alpha=0.7)
plt.plot(cumulative_returns.index, cumulative_returns, label='累计收益率', color='red')
plt.axhline(y=0, color='black', linestyle='--')
plt.title('等权重投资组合收益走势 (四只股票)')
plt.xlabel('日期')
plt.ylabel('收益率')
plt.legend()
plt.grid(alpha=0.3)
plt.show()
|

