1
2
3
4
5
6
7
8
9
10
11
12
13
14
15
16
17
18
19
20
21
22
23
24
25
26
27
28
29
30
31
32
33
34
35
36
37
38
39
40
41
42
43
44
45
46
47
48
49
50
51
52
53
54
55
56
57
58
59
60
61
62
63
64
65
66
67
68
69
70
71
72
73
74
75
76
77
78
79
80
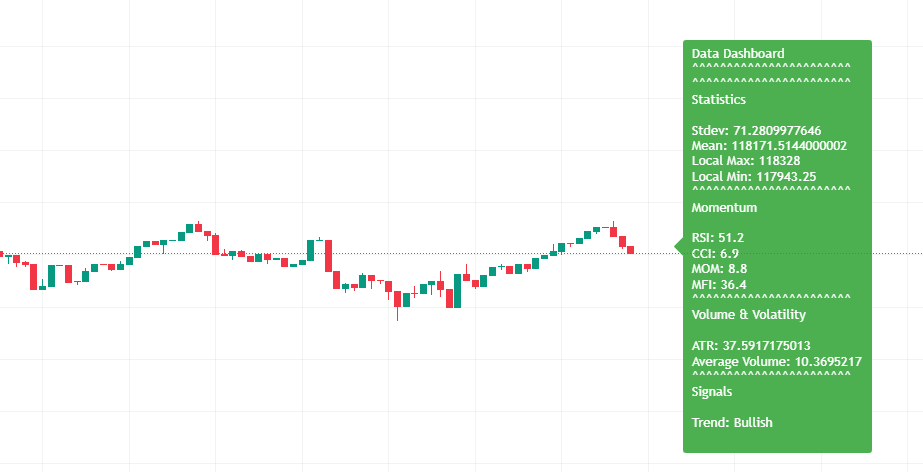
| // This Pine Script® code is subject to the terms of the Mozilla Public License 2.0 at https://mozilla.org/MPL/2.0/
//@version=6
indicator("我的脚本", overlay = true)
// 制作label合集
i_offsetLabel = input(5, "Data Dashboard Offset")
offset = i_offsetLabel * (time - time[1])
title = "Data Dashboard", splitter = "---------------------------------------", nl = "\n"
string dynamicText = title + nl + splitter + nl
var label id = na
label.delete(id)
id := label.new(x=time+offset, y=high, xloc = xloc.bar_time, text = dynamicText)
i_lookback = input(100, "Lookback Period")
i_showStats = input(true, "Show Statistics")
i_showMoms = input(true, "Show Momentum Oscillators")
i_showVolume = input(true, "Show Volume Stuff")
i_showSignal = input(true, "Show Signals")
f_round(_val, _decimals) =>
if _decimals == -1
_val
else
_p = math.pow(10, _decimals)
math.round(math.abs(_val) * _p)/ _p * math.sign(_val)
f_strHelp(_prefix, _var, _round) =>
_res = str.tostring(f_round(_var, _round))
_prefix + ": " + _res + nl
// // Statistics Section
statsTitle = splitter + nl + "Statistics" + nl + nl
std = ta.stdev(close, i_lookback)
mean = ta.sma(close, i_lookback)
max = ta.highest(high, i_lookback)
min = ta.lowest(low, i_lookback)
stats = i_showStats ? statsTitle + f_strHelp("Stdev", std, -1) + f_strHelp("Mean", mean, -1) + f_strHelp("Local Max", max, -1) + f_strHelp("Local Min", min, -1) : na
// Momentum Section
momsTitle = splitter + nl + "Momentum" + nl + nl
rsi = ta.rsi(close, 14)
cci = ta.cci(close, 20)
mom = ta.mom(close, 10)
mfi = ta.mfi(close, 5)
moms = i_showMoms ? momsTitle + f_strHelp("RSI", rsi, 1) + f_strHelp("CCI", cci, 1) + f_strHelp("MOM", mom, 1) + f_strHelp("MFI", mfi, 1) : na
// Volatility & Volume Section
volTitle = splitter + nl + "Volume & Volatility" + nl + nl
atr = ta.atr(14)
avgVol = ta.sma(volume, i_lookback)
vols = i_showVolume ? volTitle + f_strHelp("ATR", atr, -1) + f_strHelp("Average Volume", avgVol, -1) : na
// Signals
sigTitle = splitter + nl + "Signals" + nl + nl
[macd, macdsignal, macdhist] = ta.macd(close, fastlen = 12, slowlen = 26, siglen = 9)
trend = macdhist > 0 ? "Bullish" : "Bearish"
sigs = i_showSignal ? sigTitle + "Trend: " + trend + nl : na
dynamicText := dynamicText + stats + moms + vols + sigs
label.set_text(id, text=dynamicText)
// 向左对齐
label.set_textalign(id, text.align_left)
label.set_color(id, c~~o~~lor=color.black)
label.set_textcolor(id, textcolor=color.white)
label.set_style(id, label.style_label_left)
// 获取文本
labelText = label.get_text(id)
// labelText := str.replace_all(labelText, "Data", "&")
// label.set_text(id, labelText)
// label.set_tooltip(id, tooltip = stats)
if trend == "Bullish"
labelText := label.get_text(id)
labelText := str.replace_all(labelText, splitter, "^^^^^^^^^^^^^^^^^^^^^^^")
label.set_text(id, labelText)
label.set_color(id,color.green)
|

