pine多指标建立警报
编辑
1
2025-07-17

背景
pine三指标设置警报
代码
pine脚本记录
// This Pine Script® code is subject to the terms of the Mozilla Public License 2.0 at https://mozilla.org/MPL/2.0/

//@version=6
indicator(title="my RSI", overlay = true)

// Inputs
useRSI = input.bool(defval = true, title = "Use Rsi")
useMACD = input.bool(defval = true, title = "Use Macd")
useBB = input.bool(defval = true, title = "Use BB")
i_showPLots = input.bool(defval = true, title = "Show Plots")


rsi = ta.rsi(close, 14)
// MACD
[macdLine, signalLine, histLine] = ta.macd(close, 12, 26, 9)
// BB
i_bb_isrc = input.source(defval = close, title = "BB input source")
i_bb_length = input.int(defval = 10, title = "BB Length")
[middle, upper, lower] = ta.bb(i_bb_isrc, i_bb_length, 2)

// Rsi strategy
risbuyCondition = ta.crossover(rsi, 30) and useRSI
rsisellCondition = ta.crossunder(rsi, 70) and useRSI
plotshape(risbuyCondition ? low : na, text = "rsi buy", style = shape.arrowup, location = location.belowbar, color = color.green, textcolor = color.green, size = size.large)
plotshape(rsisellCondition ? high : na, text = "rsi sell", style = shape.arrowdown, location = location.abovebar, color = color.red, textcolor = color.red, size = size.large)

// Macd strategy
// 2. 将交叉信号存入全局变量(确保每根K线都计算)
crossOverSignal = ta.crossover(macdLine, signalLine)
crossUnderSignal = ta.crossunder(macdLine, signalLine)
macdbuyCondition = histLine > 0 and crossOverSignal and useMACD
macdsellCondition = histLine < 0 and crossUnderSignal and useMACD
plotshape(macdbuyCondition ? close : na, text = "macd buy", style = shape.arrowup, location = location.belowbar, color = color.green, textcolor = color.green, size = size.large)
plotshape(macdsellCondition ? close : na, text = "macd sell", style = shape.arrowdown, location = location.abovebar, color = color.red, textcolor = color.red, size = size.large)

// Bb strategy
i_bbsrc = input.source(defval = close, title = "BB strategy source")
bbbuyCondition = i_bbsrc < lower and useBB
bbsellCondition = i_bbsrc > upper and useBB
plotshape(bbbuyCondition ? close : na, text = "bb buy", style = shape.arrowup, location = location.belowbar, color = color.green, textcolor = color.green, size = size.large)
plotshape(bbsellCondition ? close : na, text = "bb sell", style = shape.arrowdown, location = location.abovebar, color = color.red, textcolor = color.red, size = size.large)


// PLOTS
// rsi plot
plot(i_showPLots ? rsi : na, title = "rsi", color = color.purple)
// macd plot
plot(i_showPLots ? histLine : na, title = "Histogram", style = plot.style_columns, color = histLine > 0 ? color.green : color.red)
plot(i_showPLots ? macdLine : na, title = "MACD", color = color.new(color.red, 50))
plot(i_showPLots ? signalLine : na, title = "Signal", color = color.new(color.blue, 50))
// bb plot
plot(i_showPLots ? middle : na, title = "bb middle", color=color.yellow)
plot(i_showPLots ? upper : na, title = "bb upper", color=color.red)
plot(i_showPLots ? lower : na, title = "bb lower", color=color.green)


// alert conditions
sellAlertConditons = bbsellCondition or macdsellCondition or rsisellCondition
alertcondition(sellAlertConditons, title = "sell alert")
设置图标添加警报
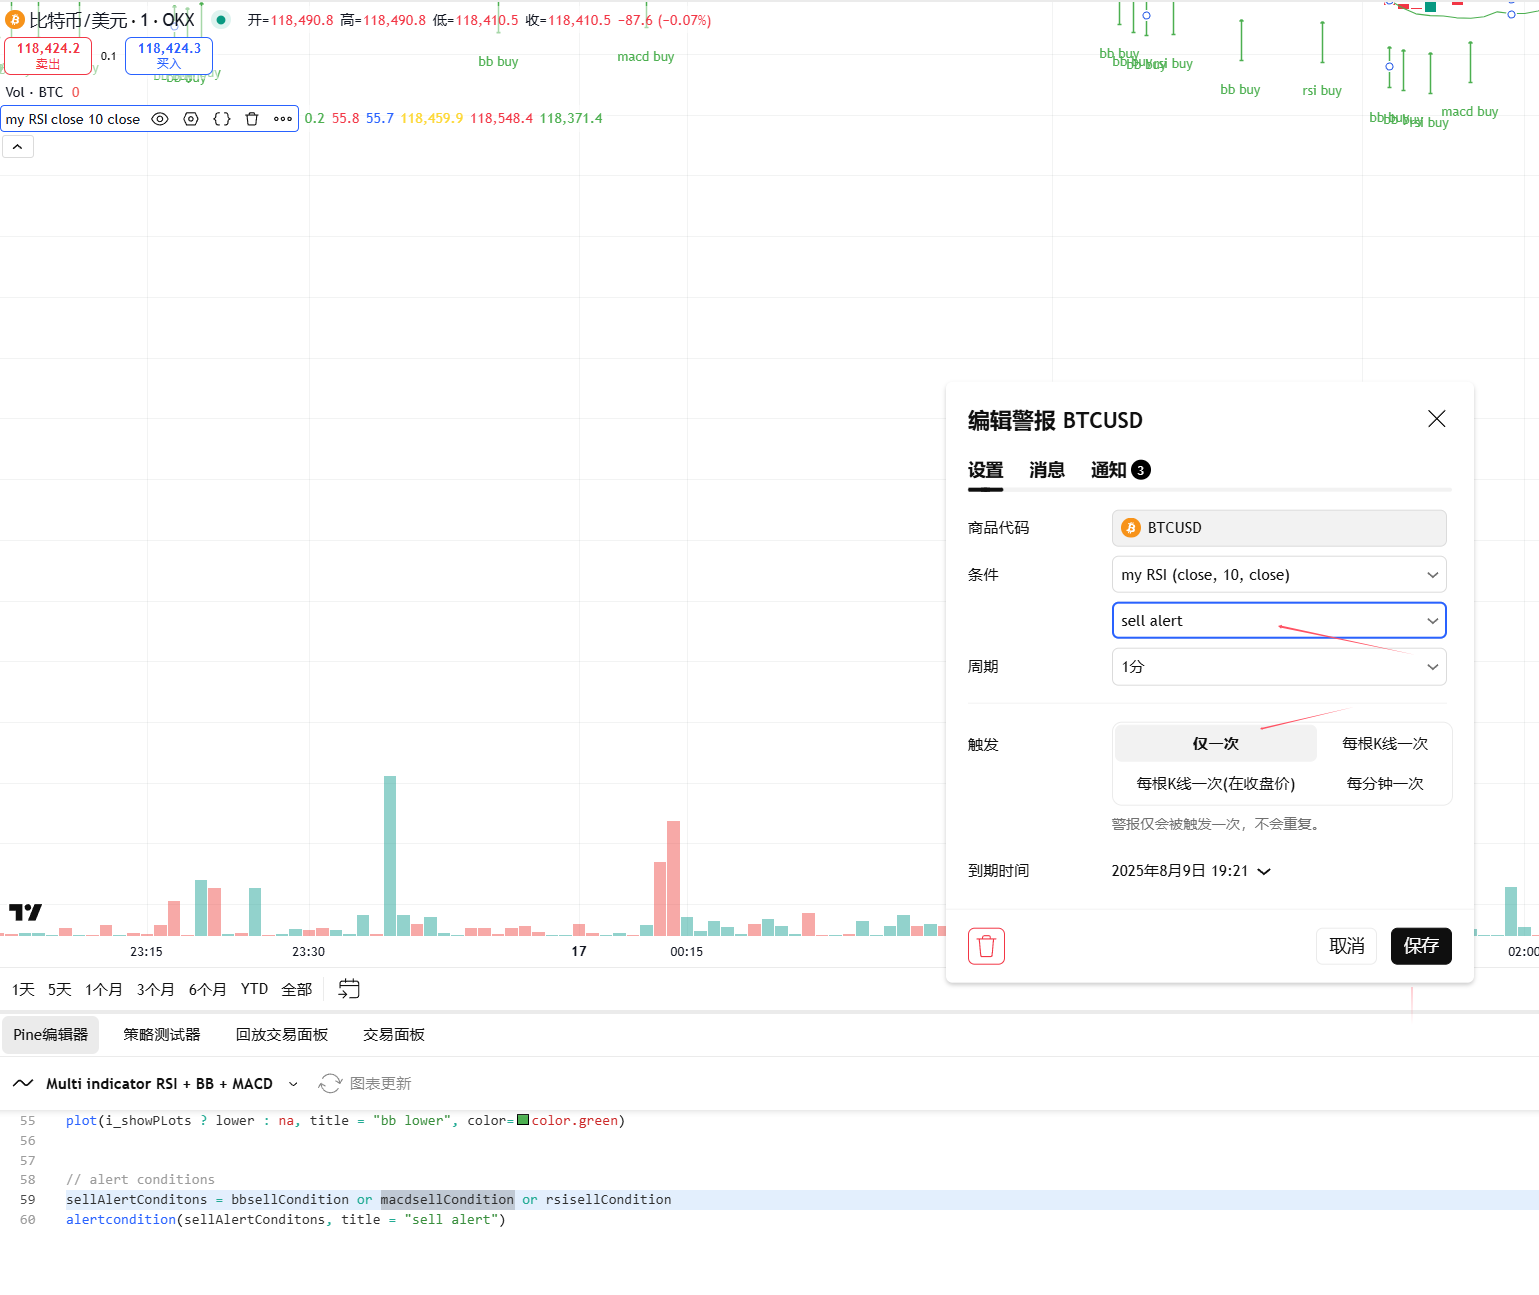
选择策略,信号,设置了仅触发1次,因为我的图表1分钟上添加的警报,很快就触发中止了。
注意
一旦设置警报,就不会被更改,所以哪怕修改pine编辑器中的代码,或者更改条件,已经添加的警报都不会变动。 所以添加警报的设置页面和已经存在的警报不是绑定一起的。
- 0
- 0
-
赞助
 支付宝
支付宝
 微信
微信
-
分享