pine画出RSI+MACD+BB
编辑
2
2025-07-08

背景
最近拾起了tradingview,记录一些pine脚本,虽然内置指标库也有,不过还是记录出来吧
RSI + MACD + BB
// This Pine Script® code is subject to the terms of the Mozilla Public License 2.0 at https://mozilla.org/MPL/2.0/

//@version=6
indicator(title="my RSI", overlay = true)
rsi = ta.rsi(close, 14)
// MACD
[macdLine, signalLine, histLine] = ta.macd(close, 12, 26, 9)
// BB
[middle, upper, lower] = ta.bb(close, 5, 4)

// PLOTS
// rsi plot
plot(rsi, title = "rsi", color = color.purple)
// macd plot
plot(histLine, title = "Histogram", style = plot.style_columns)
plot(macdLine,   title = "MACD", color = color.new(#2962FF, 50))
plot(signalLine,   title = "Signal", color = color.new(#FF6D00, 50))
// bb plot
plot(middle, color=color.yellow)
plot(upper, color=color.red)
plot(lower, color=color.green)
图如下:
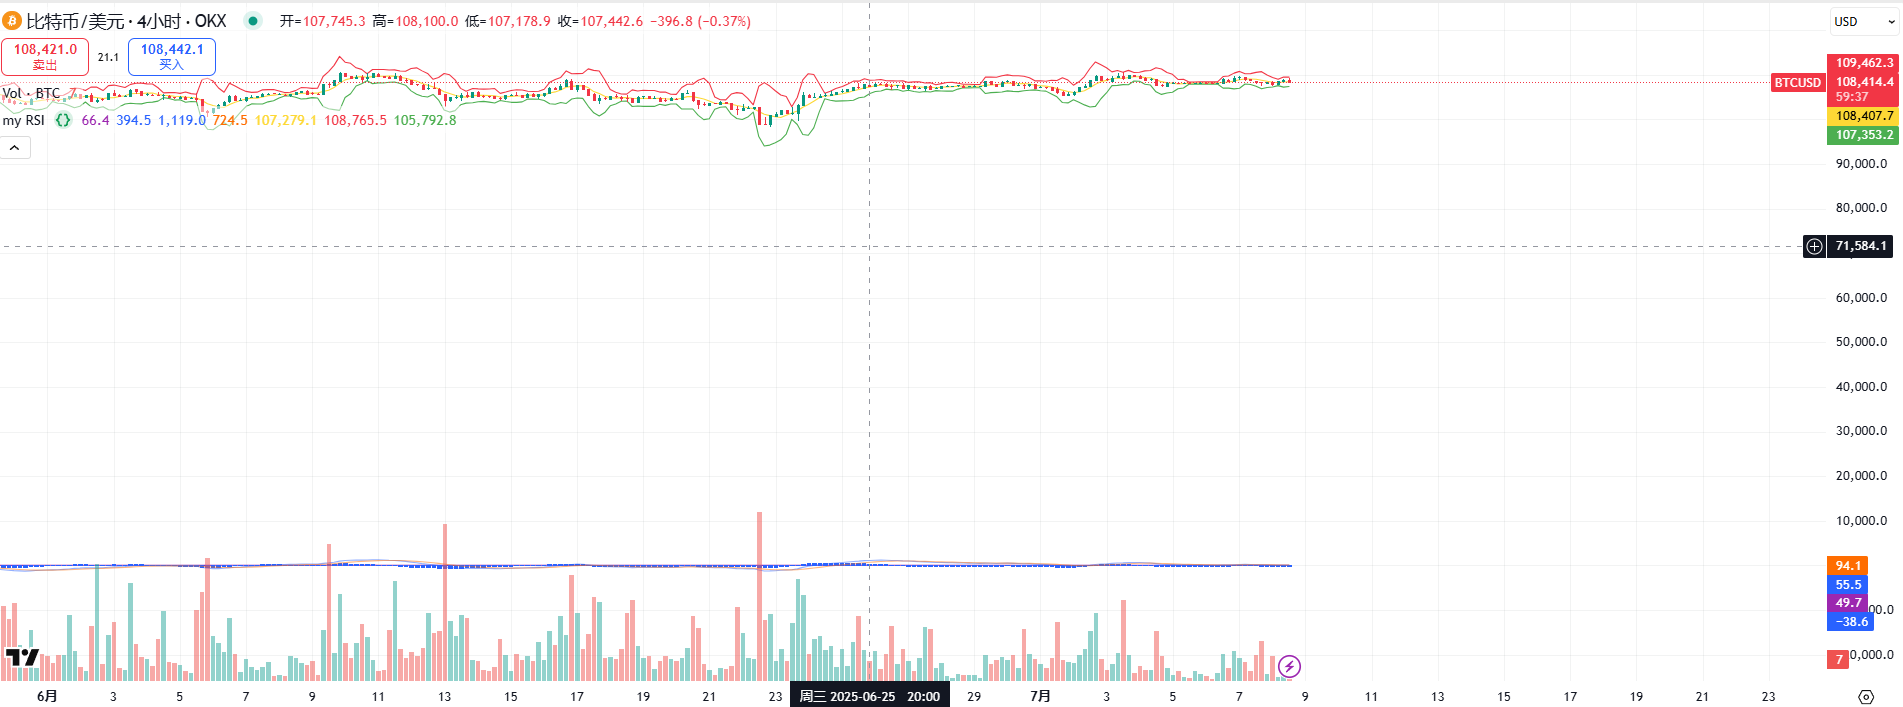
overlay = true把指标都覆盖在图表中了,因为btc现在价格好高,所以靠近0的rsi和macd都看不清除了,只看到布林带。
- 0
- 0
-
赞助
 支付宝
支付宝
 微信
微信
-
分享